The life span of a book is more like that of the horse, or the human
being, sometimes the oak, even the redwood. Which is why it seems a good
idea, rather than mourning their death, to rejoice that books now have
two ways of staying alive, getting passed on, enduring, instead of only
one.
📚 A federated network to bookmark, share and discuss good web pages
with your friends.
It’s getting harder and harder to find good web pages. When you do find
good ones, it’s worth hanging onto them. ties is your own small corner
of the web, where you can keep your favorite pages, and share them with
your friends to help them find good web pages too.
🔭 ties is in an exploratory phase where we’re trying out different ways
to make it work well. You can try it out, but big and small things might
change with every update.
DOIs, or Digital Object Identifiers, are everywhere, for a given value
of ’everywhere’. They are the identifiers used to identify and link
research outputs, and a lot more besides.
Humans are good at spotting patterns, and with something as ubiquitous
as DOIs, there are plenty of patterns to spot. However, with hundreds of
millions of DOIs and decades of history, it pays not to make
generalisations.
These all cropped up in my 10 years at Crossref. Either observed in the
scholarly community using DOIs, or when writing software to find and
handle DOIs.
As US Immigration and Customs Enforcement agents wreak havoc on American
communities, big tech companies have been making themselves
indispensable to the increasingly tyrannical state.
Among them is Amazon subsidiary Ring, the company behind those AI
doorbell cameras that have exploded in popularity over the last few
years. Back in October, Ring announced that its devices would soon be
looped into a network of Flock AI surveillance cameras. That network, an
investigation by 404 Media found, has been available to local and
federal police and enforcement agencies like ICE — leaving many worried
that their Ring doorbell cams are now feeding into a government
panopticon.
A discussion on HackerNews about the release of the data.gov archiving
effort by Harvard’s Library Innovation Lab. Interesting to see people
talking about why bittorrent wasn’t used.
The COAR Notify Protocol is a set of profiles, constraints and
conventions around the use of W3C Linked Data Notifications (LDN) to
integrate repository systems with relevant services in a distributed,
resilient and web-native architecture.
In response to this, COAR convened the Dealing With Bots Task Group to
develop advice and supporting information for repository managers to
help them to deal with this phenomenon. This website is the primary
output of the Task Group.
One important conclusion from this work is that there is no “silver
bullet” solution to this problem. It is clear that the nature of traffic
on the Web has changed, and it seems certain that repositories will
continue to deal with a range of bots, both welcome and unwelcome, and
that the behaviour of such bots will in many cases be problematic.
Repositories will need to walk a fine line between protecting their
operations from being overwhelmed by traffic from unscrupulous actors,
and maintaining their core mission of providing open access to
legitimate users and machines.
Many of us got hit by the agent coding addiction. It feels good, we
barely sleep, we build amazing things. Every once in a while that
interaction involves other humans, and all of a sudden we get a reality
check that maybe we overdid it. The most obvious example of this is the
massive degradation of quality of issue reports and pull requests. As a
maintainer many PRs now look like an insult to one’s time, but when one
pushes back, the other person does not see what they did wrong. They
thought they helped and contributed and get agitated when you close it
down.
But it’s way worse than that. I see people develop parasocial
relationships with their AIs, get heavily addicted to it, and create
communities where people reinforce highly unhealthy behavior. How did we
get here and what does it do to us?
I will preface this post by saying that I don’t want to call anyone out
in particular, and I think I sometimes feel tendencies that I see as
negative, in myself as well. I too, have thrown some vibeslop up to
other people’s repositories.
The scale of the operation is staggering, but the engineering challenge
is even deeper. How do you build a machine that can ingest the
sprawling, dynamic, and ever-changing World Wide Web in real-time? How
do you store that data for centuries when the average hard drive lasts
only a few years? And perhaps most critically, how do you pay for the
electricity, the bandwidth, and the legal defense funds required to keep
the lights on in an era where copyright law and digital preservation are
locked in a high-stakes collision?
Models, datasets, and other artifacts are stored in Git repositories.
Large files are tracked via LFS pointer files, while the Hub’s storage
backend uses XET (with Git LFS compatibility), so you get Git workflows
plus chunk-level deduplication.
On the Hub, a lot of data is forked and versioned, and even small edits
can require uploading and storing a whole new large object, even when
most bytes are identical. Clearly suboptimal.
The singular, explosive, incalculable political power of living within
the truth resides in the fact that living openly within the truth has an
ally, invisible to be sure, but omnipresent: this hidden sphere. It is
from this sphere that life lived openly in the truth grows; it is to
this sphere that it speaks, and in it that it finds understanding. This
is where the potential for communication exists. But this place is
hidden and therefore, from the perspective of power, very dangerous. The
complex ferment that takes place within it goes on in semidarkness, and
by the time it finally surfaces into the light of day as an assortment
of shocking surprises to the system, it is usually too late to cover
them up in the usual fashion. Thus they create a situation in which the
regime is confounded, invariably causing panic and driving it to react
in inappropriate ways.
Hi there! LÖVE is an awesome framework you can use to make 2D
games in Lua. It’s free, open-source, and works on Windows, macOS,
Linux, Android and iOS.
What Is Anarchism? What Is The Wooden Shoe? To put it simply, anarchism
is the the political philosophy that people are better off making
decisions for themselves, and communities making decisions for their
communities, rather than having any centralized power/governing body do
it for them. Furthermore, anarchism is opposed to capitalism and all
systems of oppression that attempt to exploit or control.
But Kafka isn’t writing tragedy. He’s writing documentary. The Samsa
family is every family under economic pressure, and their
response—incremental dehumanization, bureaucratic violence,
self-justifying rhetoric—is the ordinary response. The work doesn’t ask
“how could they?” It shows how easily they do.
A file format is like a language. An app might “speak” several formats.
A single format can be understood by many apps. Apps and formats are
many-to-many. File formats let different apps work together without
knowing about each other.
NVIDIA executives allegedly authorized the use of millions of pirated
books from Anna’s Archive to fuel its AI training. In an expanded
class-action lawsuit that cites internal NVIDIA documents, several book
authors claim that the trillion-dollar company directly reached out to
Anna’s Archive, seeking high-speed access to the shadow library data.
Early last fall, I received an unexpected email from Bill Orcutt.
Unexpected, first of all, because I had no idea he knew who I was. The
contents of his message were even more surprising: Fingerstyle guitarist
Shane Parish was at work on an album of acoustic covers of Autechre;
would I like to write the liner notes?
I didn’t even need to hear Parish’s demos for the project to respond
with an emphatic yes. I was already a fan of his 2024 album Repertoire,
where he covered Aphex Twin and Kraftwerk along with Charles Mingus,
Eric Dolphy, and Alice Coltrane, and I’d been stunned to discover his
YouTube cover of Autechre’s “Slip.” I couldn’t wait to hear how he’d
translate Sean Booth and Rob Brown’s pristine electronics for six
strings and 10 fingers.
This is the text and slides from my talk at Everything Open 2026. It's not exactly what I said, partially because I slightly misjudged my timing and had to skip through a section towards the end, but mostly it is as delivered. Video of this talk will be available at some point, when the conference volunteer AV team get to it.
Getting situated - About me
Hello!
Yes, my name is indeed Hugh Rundle.
No relation to Guy Rundle or the Rundle Mall.
Also no relation to Hugh Jackman or Hugh Grant, though it's nice of you to notice the resemblance.
I want to acknowledge we're on unceded Ngunnawal and Ngambri land today. I'll be talking this morning about maintaining knowledge systems, making the relationships between things explicit, and maintaining autonomous but connected communities. Nobody in human history has done these things better than the Ngunnawal and Ngambri people here in Canberra, the Wurundjeri where I live in Naarm/Melbourne, or the palawa people of lutruwita/Tasmania where I was born.
I've been working as a librarian for 25 years. I lead a team at La Trobe University that maintains library technology systems with a focus on metadata, collection discovery and maintaining interoperability between many internal and external systems. My work in relation to library metadata is only on the discovery side. I'm not a trained cataloguer and I am not involved in the creation of library metadata.
My hobbies include doing things on computers, and reading books, which is basically what this talk is about.
Getting situated - about you
Who do we have in the room today?
librarians?
other GLAM people?
developers/programmers?
system administrators or IT people?
FOSS project maintainers?
Where we're going today
So today I'm going to tell you a bit about BookWyrm. Then a little about how I became a maintainer. We'll explore some examples of how it has helped me think differently about librarianship, the nature of expertise, and then how you can get your professional mojo back if you're feeling burned out, and finally some lessons for maintainers and professionals.
Let's go.
A caveat about self-exploitation
Before I go any further - a caveat.
I am not advocating for workers to provide free labour for projects that their employers should be funding. If you're a worker and your workplace benefits from an open source software project you contribute to, they should be paying you to work on the project.
What is BookWyrm?
Ok, let's talk about BookWyrm! BookWyrm is a social reading application.
Users can track their reading, share quotes, reviews and comments about books, follow other users to read their statuses, and publish all of this to the fediverse via the ActivityPub standard used by software like Mastodon, Pixelfed, Pleroma, and Lemmy.
I'm really proud of BookWyrm and I think you should absolutely check it out, sign up, and contribute to the project. But today I'm not going to give you a long rundown of the features of BookWyrm. What we'll be exploring is how working on BookWyrm has helped me to think about library systems and standards, and my professional identity, in a different way.
It must be nice to read books all day
Library science is a large field with many potential aspects to be interested in and learn about.
An individual librarian will be interested in a subset of that to become expert in.
But the thing about being a librarian is that you can't really do it independently. You might be the only librarian working in your library, but the idea of a self-employed or sole-trading librarian doesn't make any sense. There's always a broader organisational context.
Librarianship can be slow to change, and our standards and practices are very sticky. Usually someone else is determining your priorities, and setting the schedule - whether than means setting arbitrary deadlines, or having your work locked in seemingly endless rounds of committee meetings.
So this is why professional education has the twin problems of "Why did they bother teaching me that?", and "I didn't learn this in Library School". Librarians can easily fall into the trap of feeling the need to defend our expertise when we feel it's not being recognised, whilst simultaneously worrying that we don't actually have any expertise worth defending.
We're stuck in the machine, with little control over our day to day work. Unable to give or receive meaningful feedback. Prevented from developing our professional identity unless it serves the direct interests of our employer. Dr Karl here would say we're suffering from an acute case of "alienated labour".
Being a maintainer
So I guess I was thinking about all of this in 2021 (what a time huh). Anyway, I discovered BookWyrm somehow. I created an account and immediately realised there was a feature I wanted that was missing - the ability to co-edit a book list with one or more other friends. I thought to myself, "I don't know anything about Django or ActivityPub, and I've never seen this codebase. But I know how to write a bit of Python code - how hard can it be?"
It turned out to be a little bit difficult, but just the right amount. So that's how I started, but how did I "accidentally" become a maintainer?
Essentially I became a maintainer on the BookWyrm by continuing to hang around, fixing bugs, making suggestions, adding new features, and eventually having the courage to review other people's code, and then I got permission to merge pull requests and realised "oh, I'm a FOSS maintainer now". So let's briefly talk about what that involves.
In BookWyrm more or less everyone is a "contributor" - you don't have to write any code. Bug reports are welcomed, even when people sometimes express themselves poorly. Feature requests are considered and left open in case someone wants to take them on.
This is basically the section of the talk where I shout out and express big love for Mouse Reeve, the originator of the whole BookWyrm project. Mouse has made a big effort to develop a strong culture of care, support, and positivity in the BookWyrm project. I've learned a lot from Mouse about how to be an open source project maintainer.
I've learned how to give code review feedback that is encouraging and clear even when identifying a problem that blocks us from merging. About how to gently approach contributors who are perhaps not being their best selves when they write a frustrated bug report, or an angry reply.
I've also learned by example that it's not just ok but is actively helpful to admit when you don't know the best approach for a problem, or you can't remember why you wrote some code that way two years ago.
I cannot emphasise strongly enough how important this community management and culture building has been. If you want an open source project to succeed, building a positive and welcoming culture is far more important than any technical work you will ever do.
So I got involved because I had a specific thing I wanted to achieve, I would have to learn a bit in order to do it but it was adjacent to my existing knowledge, and I was made to feel welcome and supported. We'll come back to these things shortly, but first I want to give a couple of examples of some specific things that made me think differently about libraries.
Network topologies: resilience needs options
I initially thought what I wanted to talk about today would be linked data. This has been the hot new upcoming thing in libraries for over a decade, despite almost no library software systems actually using it.
But eventually I realised that what I really found interesting is network topologies, and how different assumptions about how data should flow and be managed within a network can make big differences to who gets to assert things.
A great deal of book metadata is created by librarians working in individual libraries. And the way a record enters a given library catalogue is usually via what we call "copy cataloguing". The basic facts of any book are generally agreed, so instead of 500 libraries all manually creating their own record from scratch, the first one to get a copy will make a record, and then everyone shares that.
In libraries, data typically moves in a hub-and-spoke model. For that record to enter another library's catalogue, typically it will come in via one of two methods:
A "union catalogue" - typically a national library
A "knowledgebase" - which brings together and normalises multiple types of library resources including books, ebooks, academic journals, journal articles, and collections/packages. Typically these are commercial vendors
Either way, what we tend to have is libraries or publishers sending metadata in to a small number of primary nodes, and each of those primary nodes makes decisions about how to merge duplicates to create a single master record that is the most complete and accurate.
In BookWyrm, we see a different conceptual model.
BookWyrm essentially uses a peer-to-peer data model, but with some additional data sources like Open Library and Inventaire that aren't considered peers.
Instead of relying on half a dozen data sources considered to be authoritative, BookWyrm trusts anything it can find data from and then progressively enhances local records as more data becomes available. We do this by recording a bunch of unique identifiers, and adding details if we have a local match on an identifier but we're missing other data.
Title: An Example Book
Author: Sam Smith
SFID: SF1234
OLID: OL9876
As an example of this, let's say we originally import a record from Open Library. Open Library is very hit and miss with its metadata and frequently has duplicate records. So maybe our new record has an OpenLibrary ID, and maybe a Science Fiction Database ID, but no ISBN or any other identifier.
Later, someone we're following from another BookWyrm instance posts a status saying they have started reading our book, which sends a linked data object to our instance. The data in their instance came from Inventaire.
This record doesn't have an Open Library identifier but it does have an SFDB identifer, so there's something to match the two records to each other.
Title: An Example Book
Author: Sam Smith
WikiData: Q23456
SFID: SF1234 # <-- match and merge
ISBN:978-0123-4567-89
LibraryThing: LT9999
Subjects:
  - Software
  - Network Design
When our instance sees this post, it can see that our friend is referring to the same book we have from OpenLibrary. It updates our local record with the ISBN, LibraryThing ID, and subjects.
So that's cool, right?
Now, there are good reasons that libraries don't just automatically update records when they receive a POST request from another catalogue.
But in terms of network topology, why can't libraries pull records from anywhere and make decisions – whether automated or via human checks – about what to merge and what to keep?
Well the answer is that we absolutely could. In fact there are library data transfer standards for this - z39.50, which was later improved by SRU/SRW. The whole point of these is to pass data around a peer-to-peer network. But when we use these standards, it's usually to pull in records from the same big central nodes.
The centralised hub-and-spoke model is ultimately a management decision, not based on any iron laws of bibliographic data. If we decide to trust a central node to make most of the decisions for us, we can make fewer decisions ourselves, with less local expertise. That is, we don't have to employ so many highly qualified cataloguers. This is obviously cheaper, very efficient, and often it's uncontroversial for basic metadata like title and author.
But it's not without problems, one of which is that it tends to de-skill the profession, which means if we want to change the model later, we may no longer have the expertise or vision required when our situation changes. Like, maybe in future we might not trust all those central nodes quite so much.
Like many other people, English-speaking librarians got some hard lessons in geopolitics last year. With many of the biggest hubs in the hub-and-spoke model being American libraries or corporations, this ...is a problem. But it's not insurmountable.
Working on BookWyrm has helped clarify for me that our systems and data models are not set in stone. Networks are ultimately built on the questions of who do you trust, and what do you trust them to say. Network resilience requires not just a decentralised model, but the ability to decentralise judgements about what data we trust, why, and what action we're going to take as a consequence.
BookWyrm currently trusts everyone, although it is possible to disable connections from a certain node.
Libraries currently trust a small number of central nodes - three of the biggest being the Library of Congress, OCLC (based in the United States), and Ex Libris (based in Israel).
Each of these two data topologies and trust graphs has strengths and weaknesses, but the very fact they are different has been useful to my ability to think about both of them.
How to be an expert
Initially when I started helping out with BookWyrm I was very reluctant to assert any expertise at all. I was very self-conscious about my coding abilities, and had a lot to learn both about Django and the details of ActivityPub. And of course, the problem we talked about at the top: it's pretty easy to wonder whether you know anything worthwhile from librarianship when you're in my area of work.
So, how do you know you're an expert?
I finally got over myself when I started to see a few recurring conversations in the BookWyrm issues, and realised I was confused about them. Why, I wondered, is everyone talking about this well-known issue as if nobody has tried to solve it before?
That's when I realised I was thinking several moves ahead of everyone else. Not because I'm a genius, but because I had expertise in the subject matter.
I think there are two main give-aways that maybe you're an expert on something even if you don't think you are. These are both about understanding problems rather than about having the answers.
It's not that simple
The first I call "It's not that simple". In this first case, normal people think something is much simpler than it actually is.
For example, what are the defining features of a book series? In BookWyrm we currently have a model for series that boils down to this:
Some books have series
Every series has an order
Two books with the same series name that share an author are in the same series
This is a pretty reasonable heuristic if you're thinking about most fiction series. But what if it's one of those series where the original author has died and their child has continued to write more in the series, like John and Christopher Tolkien? What if it's something like a TV tie-in fiction series where some of the books are by the same author and some aren't? What if it's a non-fiction series where the authors for every book are different? What if it's a sub-series within a series, like the Rincewind books that are a subseries within Terry Pratchett's Discworld series? What if there's no particular order that the books are expected to be read in, or there are multiple accepted orders?
It's not as straightforward as you might initially think.
So I have a merge request waiting where I created a new model for Series that can deal with all these different scenarios. You might notice that it took me four years to summon the courage to assert that I knew what I was talking about there.
You're struggling because it's really hard
Our second indicator that you might be an expert I call "You're struggling because it's really hard".
In this scenario, the expert is watching people get frustrated with themselves because the non-experts think the solution should be simple, and they don't realise that experts struggle with it too.
BookWyrm is a decentralised, multi-lingual, multi-script environment with incompatible legacy data and very loose controls on data input. Show that to a cataloguing or discovery specialist in a library and they will quickly end up with a migraine or worse.
There are currently a few open requests on the project that essentially boil down to people wanting reliable authority control that can automatically display data in the language and script an individual user prefers. Now it's not that I think this is impossible, and certainly not that I don't think it's desirable. I think it's a very interesting problem. But it's also really, really hard because it's a bunch of difficult problems inside each other. Part of my role as a maintainer is to explain that it's not that we don't care about this problem, it's just going to take a while to work out some possible solutions, and we should be careful that we don't make it worse with a quick fix.
Now, I could make a joke here about Falsehoods Programmers Believe About Bibliographic Metadata. But that would be unhelpful and snarky, and that's not the kind of talk I want to give today.
You've heard me this morning talking about how BookWyrm generally works as a project where contributors with different expertise work together to solve problems. It's not a competition: to be a successful contributor you need to think like an orchestra musician, rather than like a rockstar.
Getting your mojo back with a mental health SPA
So that's my experience with BookWyrm. Now I want to tie this all together. How has working on BookWyrm helped me to get my professional mojo back, and what might we learn from that?
I think the keys here are
Stretch goals (S)
Shared Purpose, (P) and
Agency (A)
Stretch: work on things that are just a bit out of your current ability/knowledge
You're probably having PTSD right now remembering all the times your boss asked for "stretch goal" in your performance plan. What I want to talk about here has nothing to do with increasing productivity or hitting arbitrary targets. You're likely to be in a professional funk if your capabilities are not a good match for your responsibilities and goals. That can go wrong in both directions.
Humans get bored when we're entirely within our comfort zone. If you can do everything asked of you without really thinking about it or putting in any effort, you're going to have very low engagement. If your job is merely something you do to pay your bills and you're able to compartmentalise your life, that's probably not a problem. If you're like most people, however, what you work on – whether professionally or voluntarily – is part of your identity. When our work is too easy, ironically we start to feel that we're not really valued. Brains, huh.
On the other hand, if your work is too far outside your area of knowledge and skills, you have a different problem. You feel stressed. You feel like it's impossible, that you're too stupid. Maybe you don't actually know anything at all. Maybe you should give up this job and go live in the forest.
So if you want to get out of your funk, you need to be working on something in-between these two states. Where it's just a bit outside your experience and knowledge. You'll get to learn something new, but it's entirely achievable because you can build on what you alread know. This is basically what educators call scaffolded learning.
Purpose: solve problems people care about
After you've nailed the stretch goals, we need to think about purpose. What is the purpose of your work?
I think not being able to satisfactorily answer that question is the biggest cause of professional burnout. But why? It's primarily because at some point many of us wake up and realise that what our organisations say their purpose is doesn't match what they seem to prioritise.
Stafford Beer, one of the founding theorists of cybernetics and systems theory, famously stated that "The purpose of a system is what it does". It's when we are commited to the stated purpose of an organisation but the organisation is actually doing something different, that we become dissolutioned and burned out.
For example, I work in a university. Normal people think that the purpose of a university is to research new knowledge and educate the next generation.
What universities actually do, however, is publish papers nobody reads in journals nobody can afford, in order to make their numbers go up in ranking systems nobody understands, so they can attract research funding and student enrollments so they can pay people to publish more academic papers.
So what about BookWyrm? The JoinBookWyrm page says:
BookWyrm is a social network for tracking your reading, talking about books, writing reviews, and discovering what to read next.
Ok but what does the BookWyrm project do? Well, it ..talks about books, and how to connect people to those books and to each other.
Notice what neither of these statements focuses on. The purpose is not to build software. It's not dedicated to be "An ethical alternative to XYZ". It's a project to help people talk to each other about books.
So first of all, our stated purpose and what we do are aligned. This is super dooper important.
Lastly, inside that purpose, our options are quite open.
Here's where I realised something about libraries, specifically in terms of how our systems are designed, built, and managed. Very broadly, we can sort people into three roughly analagous groups within each of libraries and BookWyrm:
Libraries
Bookwyrm
Developers (vendors)
Developers
Librarians
Instance administrators
Users
Users
In libraries, there is pretty much never any communication directly between developers and users. Everything is mediated through librarians. There are a lot of reasons for this, but in essence it's because usually there is a vendor relationship between developers and librarians, and separately a service or institutional relationship between librarians and users.
In the BookWyrm project, an individual person could be a developer, and an instance admin, and a user - like Mouse. In my own case, I'm a developer and a user but not an admin. In any case, the point is that everyone in this chain is considered a first-class contributor. Bug reports and enhancement ideas directly from users are encouraged and genuinely welcomed.
It's the enhancement requests that really made me reflect on what can be missing in library software conversations. Take this request, for example:
Now it's not that library catalogues don't sometimes include information about things like "mood", "style", or the "features" of a story. But this kind of information usually comes from external plugins and third-party services, and there aren't really any standard definitions. One will look in vain for concepts like "atmosphere" or "how it will make you feel" in standard library metadata schemas.
Now, this is probably because these are really subjective and hard to pin down. But when I saw this request come through it made me think about what is and is not considered worth recording in library catalogues, and what that says about how we decide such things.
What else are we missing when we isolate our conversations with the people using our libraries from the conversations with people creating the data standards and writing the software that drives discovery?
Agency: work at your own pace on things you're interested in
So we've talked about the importance of stretch goals, and how to ensure you've aligned your purpose. Finally, I want to talk about agency. There's two aspects here that I think are important to how BookWyrm operates.
The first is not all that unusual in any FOSS project: code contributors get to choose what they work on. This is, of course, quite different to a professional workplace. I have to work on all sorts of things in my paid work that I am not particularly interested in.
FOSS is great for letting people follow their interests.
But there's another aspect that is really important, in my view, and that is about time.
One of the most corrosive things I have seen in FOSS development is the phenomenon of "stale bots". These are scripts that automatically close issues, and sometimes pull requests, after a certain amount of inactivity. The intention here is to provide clarity and close off things considered no longer relevant. But this is really just corporatising your project. It's the equivalent of a clean desk policy, where everything has to be tidied away or thrown in the rubbish regardless of any context or usefulness.
The BookWyrm project has a very relaxed attitude to time. If someone logs a bug where we're not sure whether it's been fixed, or an enhancement request nobody has had time to work on, we just leave it open until someone can pick it up. If a new feature takes months to implement, so be it. If you sent in a pull request for review, we'll try to get to it soon. But, you know, maybe all the maintainers are busy that week.
Allowing things to take as long as they take is, in my opinion, vital to the health of open source software development. If someone takes six months to finish their pull request, so be it. Maybe they've stretched themselves a bit too far and they need to develop their understanding further before finishing. Maybe they had a life crisis in the middle of it. Maybe their work life got busy. Maybe they have a baby. Maybe their country got invaded.
If you're tempted to start creating rules about how long things are allowed to sit idle, or are hassling someone to finish a new feature, consider where that impatience is coming from. Are you responding to the non-existent venture capitalists whispering in your ear about 10x growth?
The whole point of hobby software projects is that it's not supposed to feel like work.
Isn't this just "scratching your own itch"?
FOSS Old Timers might be thinking some of this sounds familar. You might be thinking "Hey, isn't this just Eric Raymond's idea that people should 'scratch their own itch'?" I would argue that it is not quite the same, and that the differences are important.
The key aspect to all of this is that you're working as part of a community. You can more easily stretch your skills and knowledge with a supportive group around you, chipping in with their own knowedge. A shared purpose keeps you on track and feels good. Feeling that you have been offered agency is nicer than feeling like nobody cares either way about what you are doing.
Now you could have Agency to Stretch yourself towards a Purpose without anyone else being involved. But if you're looking to recover from or avoid professional burnout, you'll have a lot more success if you're doing something that other people care about in relation to a shared purpose. That is, you're scratching their itch.
Most people get more satisfaction from giving gifts than receiving them.
Lessons Learned
Ok, so let's wrap this up. What are these "insights" that I promised you?
Maintainers
Does your project allow contributors to relax in the SPA? That is:
are you welcoming to contributors wanting to stretch themselves?
does your project have a clearly state and shared purpose? Are you sure that the stated purpose matches what is really happening?
do contributors have agency to work at their own pace with their own priorities? Have you created or implied a false sense of urgency? Does your project allow for multiple priorities (e.g. maintenance and new features) to be worked on separately, or is everything tightly coupled?
This is certainly not a new insight, but if you're a FOSS project maintainer then your primary job is to lead and foster the community, not to ship code.
Professionals
if you're looking for a way to respark your professional passion, consider a project that's a bit sideways from your professional expertise
never describe yourself as "non-technical" - you have technical expertise in something. There's a reason library cataloguers traditionally work in departments called "Technical Services":
Librarians (and maintainers)
Finally something for maintainers and librarians to think about. Librarians have skills that could be useful in any FOSS software project.
We're trained in "the reference interview" technique to work out what people actually want as opposed to what they asked. Librarians who do a lot of reference work are going to be great at triaging and clarifying bug reports and feature requests.
We're also trained in classifying things and organising information. Library cataloguers are going to be great at organising and labeling your bug tracker so things can easily be found, and you don't get so many duplicates.
For many, many reasons I loathe how genAI gets built into tools: both
when it’s advertised proudly as the next big feature, and when it is
obscured behind layers of technical cruft.
But, I’m ashamed to admit, recently a little devil whispered in my ear
that there are some aspects of research where genAI coupled with human
review can be helpful?
Consider this example…
I need to evaluate whether a set of publications were authored by a
given person, where there are tens of thousands of people and hundreds
of thousands of publications. Rather than reviewing each of them by hand
I:
sample the people
send a prompt off to the model that asks if the name of the given person
authored a list of publications (with all the usual hocus-pocus
instructions)
…crazy insane wasteful computation happens…
model says YES or NO
I review all the NOs and change it to YES if it looks like the model was
wrong.
Calculate percent NO
Assuming the sample size was calculated correctly, can I say that the
percent NO is a lower bound on how many are incorrect, with some
confidence and margin of error?
If the genAI got a bunch of them wrong, where some of the YES should
really be NO, the percent NO is just going to increase right?
Tell me how this method is
wrongheaded, please? Or, if you’ve seen this discussed elsewhere send me a link?
Zotero 8, which we announced today, is a huge release, representing more than a year of development. It brings together a large number of new features, improvements, and internal changes that have been in progress for quite some time.
Going forward, we’ll be changing how we manage Zotero releases, with the goal of getting stable features out to all users more quickly.
Instead of waiting months for a large update, we plan to release new versions of Zotero on a regular, rapid schedule, roughly every 6–10 weeks. These releases (Zotero 9, Zotero 10, and so on) will include new features and improvements that are ready for general use.
Between these feature releases, all changes will continue to appear immediately in the Zotero Beta, and we’ll periodically publish maintenance updates (such as Zotero 8.0.1) that include only bug fixes and small refinements to recently released features.
For Zotero users, this means:
New features will reach everyone sooner
Bug fixes are less likely to be tied to major releases
Updates will be smaller and more predictable
If you’ve been running the Zotero Beta mainly to get early access to new features, but aren’t interested in running beta software or reporting issues in the Zotero Forums, we recommend switching to the regular release version of Zotero from the download page. With more frequent releases, you won’t need to wait long to get new functionality.
We’re excited to announce our latest major release, Zotero 8. Zotero 8 builds on the new design and features of Zotero 7 and includes a huge number of improvements and refinements.
Redesigned Citation Dialog
Zotero 8 introduces a new unified citation dialog, replacing the previous citation dialog (the “red bar”), the “classic” citation dialog, and the Add Note dialog (the “yellow bar”).
The new dialog has two modes: List mode and Library mode. List mode lets you quickly search for citations from across your Zotero libraries by title, creator, and year. Library mode includes a library browser, letting you find items in specific libraries or collections. You can switch between the two modes with a single click, preserving any added items or entered search terms. By default, it will open in the last mode you used, but you can choose a different default mode in the settings.
In Zotero 7, we added the ability to quickly add citations for selected items and open documents. In the new dialog, these options are available in both List mode and Library mode, so you can make these quick selections even if you otherwise prefer to add items via the library browser.
As before, once you’ve selected an item, you can click on its bubble to customize the citation with a page number, prefix, etc. It’s also now possible to add any locator — not just a page number — right from the search bar by typing the full or short name (e.g., “line 10” or “l. 10” after the citation and pressing Enter/Return.
You can switch between adding citations and adding notes using buttons in the bottom left, corresponding to the Add/Edit Citation and Add Note buttons in your word processor.
(For those coming from the classic dialog, note that there’s no text field to make manual edits to citations. It’s been possible to edit citations directly in the document for many years, which is why the red bar didn’t include such a text field either. More importantly, though, such manual edits should be avoided in almost all cases. Instead, customize the citation via the citation dialog, which will allow Zotero to continue to update the citation as necessary.)
Annotations in the Items List
Annotations you make on PDFs, EPUBs, and webpage snapshots now show up under their parent attachments in the items list.
Showing annotations in the items list makes it easier to view annotations across a library or collection, and it also makes it possible to search for annotations directly. For example, you can search for all annotations in a collection with a given tag and then create a note from those annotations or copy them to an external text editor with Quick Copy.
In Advanced Search, you can use “Item Type” “is” “Annotation” to match annotations or use the Annotation Text and Annotation Comment search conditions to search for specific parts of the annotation.
You can assign tags to selected annotations by dragging them to the tag selector, just like other items.
Selected annotations show up in the item pane, grouped by top-level item.
Reader Appearance Panel with Theme Support
We’ve added a new Appearance panel in the reader that provides quick access to view settings and introduces support for reader themes.
The view settings are per-document settings. Themes are applied globally for all documents, including in the attachment preview in the item pane, and apply to PDFs, EPUBs, and webpage snapshots.
We offer a number of built-in themes (“Dark”, “Snow”, “Sepia”), and you can create custom themes just by specifying a foreground and background color. (Some other theme engines require additional accent colors, but we’ve tried to make this as simple as possible for users by automatically adjusting other colors based on the foreground and background colors.) You can set a different theme that applies to light mode and dark mode.
The themes replace the previous on-by-default “Use Dark Mode for Content” option, which inverted images in dark mode. We’re now simply darkening images a bit when using a dark theme. Images and ink annotations in the reader sidebar and note editor are now only darkened as well (and only when Zotero itself is in dark mode).
When possible, we also try to apply themes to PDF pages containing full-page images, such as scanned papers, by replacing whitish/dark colors with theme colors. (Otherwise we simply darken the page slightly.)
Note Tabs
It’s now possible to open notes in tabs in addition to separate windows. Note tabs fill the whole window, with wide margins for better readability and a clean, distraction-free space for note-taking.
By default, double-clicking a note in the items list will open it in a tab. You can choose to open the note in the other space from the context menu, and you can change the default behavior using the “Open notes in new windows instead of tabs” setting in the General pane of the settings.
Notes in tabs have a separate font size setting in the View menu.
Reading Mode for Webpage Snapshots
Reading Mode reformats webpage snapshots for easier reading, with unnecessary page elements removed. You can adjust line height and other view options from the Appearance panel.
Improved Tabs Menu
We’ve reworked the tabs menu to make it faster to interact with via the keyboard.
You can now press Ctrl/Cmd-; to bring up the menu at any time.
Once the menu is open, it simultaneously accepts search input, up/down navigation, and row selection, without the need to move between different parts of the menu. You can simply start typing the name of an open tab and then press Enter/Return to switch to it once you’ve narrowed down the list.
It’s also possible to quickly close multiple tabs by moving between the row close buttons with up/down and pressing space bar to close a tab.
Continuous File Renaming
Zotero now automatically keeps attachment filenames in sync with parent item metadata as you make changes (e.g., changing the title). In previous versions, while Zotero would automatically rename files when you first added them to your library, if you later edited the item’s metadata, you would need to right-click on the attachment and select “Rename File from Parent Metadata”.
You can configure which file types renaming applies to from the General tab of the Zotero settings.
After upgrading to this version, existing eligible files that don’t match the current filename format won’t be automatically renamed, but you can choose to rename them en masse from the Zotero settings. Zotero will also prompt you to rename all files if you change the filename format.
“Rename File from Parent Metadata” has been removed from the item context menu. If a filename doesn’t match the configured filename format (e.g., because automatic renaming is disabled or you changed the format but didn’t choose to rename all files), you can click the “Rename File to Match Parent Item” button next to the filename in the attachment’s item pane to rename it.
New Attachment Title Options
Zotero 7 introduced more consistent handling of attachment titles, preserving simpler, less-redundant titles (e.g., “Full Text PDF” or “Preprint PDF”) in cases where the title was previously changed to match the filename. Zotero 8 further refines its renaming and titling logic when adding multiple and/or non-primary attachments, to bring the functionality better in line with the intended behavior.
We’ve also added a “Normalize Attachment Titles” option under Tools → Manage Attachments to update old primary attachments with titles matching the filename to use simpler titles such as “PDF”.
While we recommend the default behavior, allowing Zotero to rename primary files and keep them renamed while using simpler titles in the items list, if you really prefer to view filenames instead of titles, you can now enable “Show attachment filenames in the items list” option in the General pane of the settings.
ARM Linux Support
Zotero 8 adds a version for Linux running on ARM64 devices. This includes ARM-based Chromebooks, Apple Silicon Macs running Linux (Linux VMs, Asahi Linux), and Raspberry Pis.
If you’ve been unable to run Zotero on your ARM-based device, or you’ve been running the x86_64 version under emulation, give it a try.
User Interface Improvements
We’ve made a number of changes across the interface to address common requests:
A new button in the library tab allows you to quickly close the item pane without dragging its edge or using the menus.
You can reorder item pane sections by dragging their icons in the side navigation bar.
You can drag items, collections, and searches into the trash.
You can drag attachments, notes, and related items from the item pane (e.g., to copy files to the filesystem or use Quick Copy).
Collections automatically expand when you drag over them, making it easier to drop collections or items into subcollections.
You can delete attachments from the item pane.
Tabs maintain their size as you close them for faster closing of multiple tabs.
Tag Autocomplete and Note Field in Zotero Connector
With Zotero 8, the Zotero Connector save popup can autocomplete tags in your Zotero library and allows you to add a note to items as you save them.
And Much More
Zotero 8 includes much more than we can list here. See the changelog for additional details.
System Requirements
Zotero 8 requires macOS 10.15 or later, Windows 10 or later, or a Firefox 140–compatible Linux system.
This post was written by Noah Garcia, who attended the 2025 DLF Forum as a Student Fellow. The views and opinions expressed in this blog post are solely those of the author and do not necessarily reflect the official policy or position of the Digital Library Federation or CLIR. 2025 Student Fellowships were supported by a grant from MetaArchive.
Noah Garcia is an emerging information professional and lens-based artist pursuing an M.S. in Library Science – Archival Studies (2025) and an M.F.A. in Studio Art – Photography (2026) at the University of North Texas. His work specializes in the digitization and preservation of cultural heritage materials. As the Graduate Services Assistant in UNT’s Digital Projects Lab, he has developed expertise in imaging technologies, metadata, and digital library standards, contributing to projects for The Portal to Texas History and UNT Digital Library. In 2024, he received the Texas Conference on Digital Libraries Student Excellence Award for his innovative digitization tools. His work has been presented at state-wide and regional conferences.
Attending the 2025 Digital Libraries Federation Forum as a Student Fellow was incredibly enlightening and a huge privilege. I am very grateful to CLIR and DLF for the Fellowship. Without the financial and logistical support provided through the program, I would not have been able to attend the conference.
The 2025 DLF Forum was my first national conference. Listening to and learning from information professionals from a diverse collection of institutions was beyond helpful. As I close out my time within my MS-LS program, it was beneficial to realize what I do know and have experience with – and what I do not. These realizations do not feel like limitations, but rather more like a roadmap of new skills to learn and continue developing as I transition from a student to an emerging professional.
I have worked within the UNT Libraries Digital Projects Lab as the Graduate Services Assistant for two and a half years, which has fostered a particular interest in digitization and the preservation of archival cultural heritage materials. I have primarily worked with 2-D materials, so the session We Thought It Was One Tape, One Record: Metadata Mayhem and Workflow Lessons from a Large-Scale A/V Digitization Project by Louise Smith, Katie Ehrbar from the University of Southern California provided lots of valuable insight into the digitization of A/V materials in seventeen different formats and the metadata that followed after. I particularly enjoyed seeing the creativity involved in the digitization of vinyl records, where records had to be recorded physically upside down and backwards and then digitally reversed to correct the recordings. I am always reminded about how creative one has to be while digitizing unique materials, so it was fun to see that reflected within their presentation.
As expected, several of the presentations and conversations revolved around technologies like artificial intelligence and ways that institutions are engaging with and adapting to the rapidly changing models of AI. As both a library student and visual artist, the implementation of AI feels both exciting and something I am very tentative about. This was certainly reflected in the post-presentation discussions and questions, where enthusiasm for efficiency met apprehension over ethics and an overall desire for clearer best practices.
Outside of the presentations and case studies, I particularly enjoyed meeting new friends, mentors, and colleagues from around the country at the coffee breaks and mealtimes. I am especially thankful for the DLF Mentor/Mentee program which allowed me to connect with my DLF mentor Snowden Becker and fellow mentee Ying Hu before, during, and after the conference proceedings. These more informal conversations proved to be some of the most meaningful, allowing for guidance and reflection on professional paths, upcoming challenges, and personal insights that extended beyond the conference themes. Building these connections reinforced the community-based nature of the field and affirmed my pathway within digital libraries.
Overall, my experience at the 2025 DLF Forum was grounding and motivating as I finish out my MS-LS studies and prepare to enter into the world of GLAM institutions and digital libraries. The Fellowship not only made my attendance possible, but also affirms the importance of including student voices within dialogue about current and future library practices. I am incredibly grateful for the opportunity to attend the Forum, and I look forward to hopefully returning in the future!
Reyes Ayala, B. (2025). Towards a better QA process: Automatic detection of quality problems in archived websites using visual comparisons. In M. Cornia et al. (Eds.). Proceedings of the 21st Conference on Information and Research science Connecting to Digital and Library science, 3937. Udine, Italy: CEUR Workshop Proceedings https://ceur-ws.org/Vol-3937/
Measuring Visual Correspondence With Web Archiving Screenshot Compare Tool
Reyes Ayala created the Web Archiving Screenshot Compare tool which assists with automating quality assurance by comparing screenshots of the live web page and the archived web page and determining the visual correspondence. The process for generating screenshots involves several steps. First, the tool reads the settings file that contains the seed list. For each seed, it checks if the web page exists and, if so, takes a screenshot. Next, the tool creates a CSV file with a list of the Archive-It URI-Ms associated with the archived versions of the seed. Then, the Web Archiving Screenshot Compare tool takes a screenshot of each archived web page. Finally, the URI-Ms and their screenshot file names are written to a CSV file.
After the screenshots are taken, the Web Archiving Screenshot Compare tool can use an image similarity metric to compute a score. Before computing a score, this tool checks if the live web page screenshot is not blank and then will crop a screenshot from the (live screenshot and archived screenshot) pair if both images are different sizes. After the score is computed it is output to a CSV file.
Determining the Effectiveness of the Image Similarity Metrics
The image similarity metrics supported by the Web Archiving Screenshot Compare tool are Structural Similarity Index (SSIM), Mean Squared Error (MSE), Normalized Root Mean Square Error (NRMSE), Perceptual Hash (P-Hash), Peak Signal to Noise Ratio (PSNR), and a percentage similarity metric that Reyes Ayala created. Three of these metrics (MSE, P-Hash, and PSNR) were discarded from her evaluation, because these metrics did not have an upper bound. The percentage similarity metric was also discarded, because it had a strong negative correlation with NRMSE.
The dataset that was used for the evaluation included 221 pairs of screenshots of the live and archived web pages. The archived web pages were from four Archive-It collections (Idle No More, Fort McMurray Wildfire 2016, Western Canadian Arts, and Government of Canada). After calculating the similarity scores on her dataset, she sent the screenshots to Amazon Mechanical Turk (AMT) so that she could compare the computed scores to reviewer scores. An example of an image pair that was shown to participants from Amazon Mechanical Turk is shown in Figure 1.
Reyes Ayala found that SSIM and NRMSE were able to detect high and low visual correspondence after performing statistical analysis using tests of significance. The metrics she used were one-way multivariate analysis of variance (MANOVA) and univariate analysis of variance (ANOVA). The scores for MANOVA, when using a combined dependent variable were: 𝐹(2, 222) = 44.95, 𝑝 < .001; Wilks’ 𝜆 = 0.71; Pillai’s trace = 0.29, partial 𝜂2 = 0.29 . The scores (with a Bonferroni 𝛼 adjusted level of .025) for the univariate ANOVAs were: SSIM: 𝐹(1, 223) = 10.53, 𝑝 = .001; partial 𝜂2 = 0.05 and NRMSE: 𝐹(1, 223) = 89.52, 𝑝 < .001; partial 𝜂2 = 0.29.
Reyes Ayala created the Web Archiving Screenshot Compare tool, which is used to determine the quality of an archived web page by comparing the screenshots of the live web page and the archived web page. After creating a dataset of 221 pairs of screenshots and retrieving human review scores, she performed statistical analysis using tests of significance. She found that the Structural Similarity Index (SSIM) and Normalized Root Mean Square Error (NRMSE) were able to distinguish between high quality and low quality archived web pages.
For our web archiving livestreams, we currently measure the performance of the web archive crawler during the livestream and plan to measure replay performance during future livestreams. Writing this paper summary has helped with learning about another approach that could be used to measure visual correspondence during a web archiving livestream.
You've all noticed that Google is a bit shit lately, right? You get AI answers instead of decent search results, and for me at least it always sends me to Reddit where there's more AI shit.
Quite a few of the bloggers I follow have been talking about how they are extracting themselves from the services run by the big tech companies, for all sorts of reasons to do with risk, privacy, social justice and so on. This post is just another reminder that maybe using stuff from Google et al is not such a great idea.
This story is kind of funny, but it's also very sobering.
We were in this meeting today, me, Moises, Ben and we were joined by River who guessed the Zoom room ID and joined us. We were working on this presentation, only as you see here in this screenshot the slide notes were not showing up for Moises.
(The bottom of the page where there is normally some stuff is just a void)
Not in Safari, not in Chrome, and not in Firefox. I was all, like "Works for me" in the tab I'd had open all week, and wondering if it was a recent permissions change I'd made. But no, turned out it didn't work for Ben or River, and if I opened the presentation in a new browser session it didn't work for me either.
And then River said - hey, it looks like it's something to do with this. He'd done the developer thing and opened the develop tools and had a poke around the screen and found this:
This happens to be right before the speakernotes-container div - where, one assumes the speaker notes live.
<div id="speakernotes-container"> ... </div>
Yep there's a an element in Google's office product used by millions of people with a class called appsSketchyGenerativeaiNudgesCanvasNudgeSurfaceSoyContainer. May contain traces of sketchy generative AI but least it's lactose free :-). The fact that it's a class indicates that it might be used in more than one place, so who knows what else it is breaking.
You can't make this stuff up. You need a SketchyGenerativeai for that, though to be fair there are actually other bits of the interface that have sketchy in the name - maybe it doesn't mean shitty in this context?
And then Ben said if you delete that class the page works again. The little handle reappears and you can drag it up to see your notes.
The little handle:
And we're back:
Now we do pay for this Google stuff at work and I use it for all sorts of things and I also pay. But I am thinking that this is a very good reminder to get thinking about how to move all our stuff to services that are not, you know, turning to shit.
This paper explores the lived experiences of disabled patrons in public library spaces, investigating how dysconscious ableism manifests in their daily interactions. Dysconscious ableism is an impaired or distorted way of thinking about disability and that tacitly accepts dominant ableist norms and privileges. Drawing on critical theory and ethnographic methods, the paper uncovers pervasive, oppressive experiences and challenges within library environments. Specifically, this paper presents four key ways dysconscious ableism surfaces in disabled patrons’ experiences. Patrons seek out community and belonging while often feeling judged or dismissed. Patrons engage in access and comfort seeking such as when navigating physical and sensory-related barriers. Patrons with non-apparent disabilities experience skepticism toward their disability authenticity and identityresulting from limited understandings of disability. Lastly, disabled patrons engage in emotional and cognitive management labor to navigate stigma and maintain dignity, reflecting internalized oppression and dominant ableist norms. By centering these previously underrepresented voices, this research offers a critical understanding of dysconscious ableism in public librarianship. It advocates for genuinely inclusive and supportive library environments that prioritize lived experience in design and practice.
Introduction
Public libraries serve as vital community spaces, offering free access to books, technology, internet, cultural programs, and job resources, while helping close the digital divide (Horrigan, 2016; Howard, n.d.; IMLS, 2021; Public Library Association, n.d.; UNESCO & IFLAI, 2022). Yet, disabled patrons often face barriers including microaggressions, inaccessible facilities and services, discriminatory comments, and inconsistent access to assistive technologies and formats (Anderson & Phillips, 2021; Kimura, 2018; Liu, Bielefield & McKay, 2019; Muir, Thompson & Qayyum, 2019; Siraki, 2021). These experiences are examples of dysconscious ableism—an impaired, distorted or incomplete way of understanding disability (Broderick & Lalvani, 2017).
Dysconscious ableism is also found in Library and Information Studies (LIS) scholarship. Disability frameworks may be omitted (Oud, 2018), reduced to legal compliance (Adkins & Bushman, 2015; Graves & German, 2018), or framed through deficit-based medical language (Adesina, Saliu & Ambali, 2018; Kleynhans & Fourie, 2014; Sambo, Rabiu & Shaba, 2016). Adkins and Bushman (2015), for instance, used “mental retardation” years after Rosa’s Law (2010) replaced it with “intellectual disabilities,” reflecting both documentary epistemic injustice and dysconscious ableism (Broderick & Lalvani, 2017; Smith & Patin, 2024). Adkins and Bushman’s use of “special needs” further reinforces a medicalized, infantilizing view of disability (Gill & Myers, 2023).
Many LIS researchers default to medical, legal, or charity models, often misusing identity-first language without understanding its cultural significance (Gibson et al., 2021). Methodologies also reveal ableist assumptions that exclude disabled voices and rely on non-disabled staff or parents (Adkins & Bushman, 2015; Gibson & Martin, 2019; Prendergast, 2016). Prendergast, for example, interviewed librarians and parents about early literacy for disabled children but omitted the children themselves and did not acknowledge this.
A growing body of LIS scholarship has centered disabled perspectives: Oud (2018) interviewed disabled academic librarians; Yoon et al. (2016) conducted accessibility testing with visually impaired users; Adesina et al. (2018) surveyed disabled university patrons; Anderson (2018) analyzed autistic users’ forum discussions. While critical research has addressed disability in academic libraries (Schomberg, 2018) and raced and gendered practices (Smith & Patin, 2024; Wagner & Crowley, 2020), disabled experiences in public libraries largely remain underexplored.
Broderick and Lalvani (2017) identified dysconscious ableism among graduate students preparing as public teachers. Public libraries and schools share intertwined histories and missions. In 1830s New York, for instance, legislation enabled public schools to purchase books and establish libraries using tax funds (ALA, 2011). Both professions have long been dominated by white, female-presenting individuals, shaping their workforce and professional culture. This gendered composition has contributed to lower salaries compared to male-dominated fields (Ali, 2022; Ettarh, 2018; Hathcock, 2015; Lawton, 2018; Will, 2020). Historically, both have faced inconsistent funding, relying primarily on local taxes with limited state and federal support. As human service fields, they are deeply committed to fostering community growth through education and learning spaces (Allegretto, García & Weiss, 2022; Matthews, 2021; National Organization of Human Services, 2015; Ren, 2013; Wheeler, 2021).
Similar patterns of dysconscious ableism may exist in LIS preparation programs. Without critical reflection and disruption of ableist mindsets, such biases may shape library services, contributing to ongoing exclusion. This paper arises from a wider study on how dysconscious ableism operates in the mindsets of public librarians and the policies of public libraries, leading to impacts on the lived experiences of disabled patrons (Myhill, in press). This paper specifically reports on how dysconscious ableism affects disabled patrons in public libraries, using firsthand accounts to explore how ableist norms inform library environments and interactions.
A Note About Language
As a disabled scholar (visit the ethnographic section below, “Positionality and Reflexivity”), I use identity-first language to affirm disability as a valued identity and stand in solidarity with the community. This choice reclaims stigmatized terms as expressions of pride and empowerment, reflecting respect, resilience, and belonging. While I honor those who prefer person-first language, identity-first language resists marginalization and aligns with how many define themselves through shared history and strength (Foley, 2024).
Theoretical Framework and Methodological Approach
In this section I discuss my rationale and uses of critical theory and ethnographic methods to guide the underlying study. In particular, the concept of dysconscious ableism arises from critical disability studies (CDS), and I apply a critical lens in conducting ethnography.
Critical Theory
Critical theory holds that while the world is knowable, knowledge is shaped by dominant social values and interests, and is not neutral or objective (Diem et al., 2014). It exposes how seemingly impartial systems perpetuate inequality across race, gender, ability, and other identities, aiming to foster social transformation by centering marginalized lived experiences, and offering comprehensive insights into systems of oppression (Gill & Myers, 2023; Meekosha & Shuttleworth, 2009; Rokay, 2021). Reflexivity and researcher positionality are key to this approach (Madison, 2012). Within this framework, CDS radically rethinks disability through political and socio-cultural lenses, rejecting deficit-based views. CDS critiques binary thinking and institutional co-option of disability discourse, while employing tools like intersectionality, feminist ethics of care, and collective responsibility to advance equity (Bohonos, 2019; Dirth & Adams, 2019; Kafer, 2013; Loyer, 2018; Meekosha & Shuttleworth, 2009; Schomberg, 2018).
Broderick and Lalvani (2017), drawing on King’s (1991) seminal work on dysconscious racism, introduced “dysconscious ableism” to describe how pre-service teachers often retain deficit-based views of disability. Broderick and Lalvani defined “dysconscious ableism as an impaired or distorted way of thinking about dis/ability (particularly when compared to criticalist conceptualisations of dis/ability), one that tacitly accepts dominant ableist norms and privileges.” (p. 895). To better understand this concept, I distinguish it from associated concepts. Unconsciousness (“not” conscious) describes what we’re unaware of, a term often used to explain implicit bias (Beegly & Madva, 2020). Subconsciousness (“below” conscious) refers to beliefs beneath awareness. Dysconsciousness (“ill/bad” conscious) suggests flawed or distorted awareness of internal or external realities. Each prefix—un, sub, and dys—creates distinct meanings about awareness.
For the purpose of the study, I defined dysconscious ableism to operate in societal practices and beliefs that:
reflect a limited, incomplete, impaired, or distorted way of thinking about or understanding of disability; or accept deficit and culturally sanctioned assumptions, myths, and beliefs about disability, or
tacitly accept dominant ableist norms, privileges, and the status quo, or present no fundamentally alternative vision of society, or
promote inequity or inaccessibility or segregated treatment or exploitation of disabled persons.
Ethnographic Methods
Critical ethnography, rooted in critical theory, seeks to uncover hidden power structures and elevate marginalized voices (Gulati et al., 2011; Madison, 2012; McCabe & Holmes, 2013). Ethical research in this tradition emphasizes cultural humility, reflexivity, and deep respect for participants’ autonomy and well-being (Farrugia, 2022; Loyer, 2018; Vincent, 2018). Researchers must recognize their own positionality and use their work to promote equity and liberation (Madison, 2012). Madison urges scholars to reflect on the ethical purpose of their research and to intentionally share their lived identities and privileges to clarify their relationship to the work. Reflexivity, Madison argues, is essential for examining assumptions and guiding researchers to question the origins of their theories and paradigms. It prompts critical awareness of which voices are excluded or overly generalized, encouraging more inclusive and mindful scholarship. For the purpose of this paper I use the term “inclusive” to refer to the experiences of spaces, services, and programs where all persons are well-treated, valued, and included in core decisions – especially including those who have been historically excluded from these experiences (Ortlieb, Glauninger & Weiss, 2021).
I bring both privilege and lived experience to this work. As a white, cisgender male, U.S.-born, middle-class, able-bodied person fluent in speech, sight, and hearing, I’ve benefited from trust, access, and resources often taken for granted. Yet, I’m also an adoptee, suicide attempt survivor, recovering alcoholic, and someone managing depression, anxiety, and Tourette syndrome. Raised by a disabled adoptive mother, I’ve long worked alongside disabled communities. My public library experiences have been shaped by privilege—uninterrupted access, personal transportation, and no need for assistive technologies. These realities inform my understanding and highlight the need to center disabled patrons’ experiences.
With over 30 years in disability services, legal and educational training, and experience teaching accessible library services, I bring expertise to this study. Still, I recognize the potential for unconscious assumptions and strive to balance my knowledge with respect for library professionals and disabled individuals’ lived expertise. I engaged in formal reflexivity before recruitment and coding, and informally through memoing to track my evolving understanding.
Ethical recruitment was central to this study, prioritizing participant welfare, dignity, privacy, and voluntary engagement. Aware of potential power imbalances due to my credentials and role, I practiced cultural humility to reduce coercion risks (Tervalon & Murray-Garcia, 1998). Recruitment aimed for diverse disability representation while acknowledging historical exploitation in research (Stack & MacDonald, 2018). Grounded in the presumption of capacity, the study affirmed all adults’ decision-making rights, including those with intellectual disabilities (Carey & Griffiths, 2017; Foley, 2024). Accessibility was supported through Easy Read materials (Harding, 2021) and optional support companions. A nine-member Advisory Group of diverse disabled colleagues—including people of color and LGBTQ+ individuals—met quarterly and received mid-quarter updates to provide feedback and guidance throughout the study. Outreach included flyers, newsletters, social media, and disability networks, with a goal of enrolling six to eight disabled public library patrons.
Participants self-disclosed their ages ranging from 19 to 59, with a median age of 34. They further identified with physical, intellectual, mental, neurological, and learning disabilities, and neurodivergency (Table 1). In meeting these participants below, I practiced an anti-oppressive research practice that demands intentional inclusion, reflection, and representation of lived identities to honor and affirm participants, disrupt dominant power relations, produce rigorous scholarship, and contribute to transformative change (Madison, 2012).
Table 1
Summary of Patron Demographics
Patron
Age
Gender Identity
Disability Status
Richard
59
Male
Parkinson’s
Alice
19
Female
Intellectual & Developmental Disability
Ben
31
Male
Down’s Syndrome
Georgina
34
Female
Neurodivergent and PTSD
April
26
Female
Autism spectrum and Undifferentiated connective tissue disease
Turner
50
Male
Autism, bipolar disorder with schizoaffective disorder, major depression
I conducted semi-structured interviews with participants in their preferred format: two in person, two by phone, and three via Zoom. All participants provided informed consent for audio recording. Breaks were offered during interviews, and one participant had a family member present to assist with communication. Participants were informed they would receive transcripts for review and that all identifying information would be anonymized (Carey & Griffiths, 2017). All participant names are pseudonyms.
Critical thematic coding was guided by the work of Broderick & Lalvani (2017), King (1991), Kafer (2013), and Okun (2021), serving as a flexible framework rather than a rigid structure. Coding was iterative, with memos used to define emerging themes (Madison, 2012). For instance, I developed the code “Management Labor” to capture the emotional and cognitive work disabled patrons perform in managing others’ assumptions and navigating inaccessible spaces.
Disabled Patron Experiences
Disabled public library patrons presented experiences that reflect the operation of dysconscious ableism across four key themes: finding community and belonging, access and comfort seeking, disability authenticity and identity, and management labor. I discuss these themes in turn.
Finding Community and Belonging
Patrons interviewed shared mixed views on the public library as a welcoming space. For Ben, who identified as a White, heterosexual male with Down syndrome, the concept of the community was central. He appreciated tailored, though segregated, programs like karaoke, chair yoga, and sensory-friendly movie screenings. These offered joy and connection: “I participate in many programs as well. Like, like, yeah, like, I’m in [Agency]1. So, we do like karaoke sometimes when we sing and dance and just have fun.” Ben advocated for “more programs for people who have Down syndrome,” emphasizing how much he and his friends enjoyed them, perhaps because these events presented affinity experiences where participants felt they belong rather than othered. He especially valued spending time with disabled peers and mentors at the library. Polly, who identified as a Mixed-raced, heterosexual female with a learning disability and physical limitations, echoed this, recalling her time with [Social Service]2, which took disabled groups to the library. She found librarians “immensely helpful and accommodating.” Yet these programs perpetuate the segregation of disabled patrons (Gill & Myers, 2023).
In contrast, Georgina, who identified as a neurodivergent, pansexual, “Black American” female with post-traumatic stress disorder (PTSD), emphasized the need for improvements to feel welcome. They called for diverse, open-minded staff “who look like me, who navigate the world…in different and varying ways,” challenging the norm of “white cis women in library spaces.” Georgina felt pressure to perform as a “good” patron—reading or using computers—rather than experiencing the library as a community space: “There’s not this other space for, like, community.” This comment of being a “good” patron highlights societal expectations of status quo behavior. Georgina hoped libraries could become places “where all types of different folks…can come to a space and feel like they’re seen and welcomed and not like they’re a burden.” Concerns also emerged around library policy enforcement. Georgina mentioned people being removed for “certain reasons,” suggesting vague or unfair practices. Such experiences may deny experiences of community as they erode trust and deter future visits.
Ben also recognized broader societal stigma: “A lot of people are not OK with me having Down syndrome. But I can’t control that.” Ben’s experiences of judgment reflect the accepted deficit and culturally sanctioned beliefs about disability. Richard, who identified as a White, heterosexual male with Parkinson’s, felt dismissed and overlooked by library staff when discussing technology: “I sometimes find people can’t come to grips with a disability and an expertise.” Richard’s account of microinvalidation further reflects society’s limited or distorted way of understanding disability. Ben recalled microinsultive experiences in high school: “Well they talked to me, but I felt like they’d talk right, right through me,” which reinforced feelings of invisibility. April, who identified as an autistic, White, bisexual female with physical limitations, remarked on the experience of a microaggressive denial of identity or privacy, “It can be uncomfortable when people seem to question or stare at me. I would be much more comfortable if someone approached me directly and asked about my situation.” Collectively these microaggressive experiences reflect dysconscious distorted understandings of disability that marginalize disabled individuals, reinforce feelings of invisibility, and limit their full participation. These accounts highlight the operation of dysconscious ableism and the need for libraries to foster more inclusive, affirming environments, where disabled patrons are not only accommodated but respected as belonging members of the community.
Access and Comfort Seeking
Patrons expressed appreciation for the proactive accessible features in their libraries, suggesting a modest understanding of universal design principles. Richard noted the value of “ramps in and out of the parking lot,” while April described having an “easy time getting around” in a wheelchair. April appreciated quiet, secluded areas that offered “an extra level of calm for those who need it.” Polly praised the “little cubbies … where you could just go in and sit down and just, like, not get distracted when you’re reading,” adding that the dividers seemed soundproof and encouraged focus.
However, patrons also identified barriers. April preferred “more ambient lighting … as opposed to the bright, harsh lights.” Turner, who is autistic and sensitive to noise, said, “I do really prefer the old-style library,” where librarians expected silence. He explained, “I have, what’s it called, collapsed tolerance for … normal everyday noises,” and found library programming overwhelming. These examples highlight ongoing challenges with sensory accessibility and present no fundamentally alternative vision of library culture.
Patrons also described needing more assistance. April wanted librarians to proactively check on patrons but noted that while staff were “always willing to help,” this sometimes compromised her independence. Alice, who identified as a White female with an intellectual disability, struggled with small print and locating accessible materials like large print or easy-read books. She believed libraries could better support disabled patrons “by helping others to be successful,” though she did not specify how. These accounts suggest that while some accessibility features exist, gaps that tacitly accept dominant ableist norms remain and limit the creation of fully inclusive, comfortable, and empowering environments for disabled patrons.
Disability Authenticity and Identity
Patrons shared challenges around authenticity and identity. April, an ambulatory wheelchair user, who could stand and walk for limited periods, described feeling judged for using a wheelchair: “When I stand up to do something, it often leads to questioning looks, as if people are doubting whether I need the wheelchair or not. It can make you feel uncomfortable and unwelcome.” Richard also questioned his sense of belonging after applying twice to the home delivery program without a response. Home delivery allows patrons to check out materials from home and have them delivered because of a challenge they experience getting to the library. He suspected the library staff limited the service to those with more visible impairments, leading to his feelings of exclusion: “In the library I think they question whether or not a disability is … apparent by looking at someone.” He added, “People question it thinking that they’re getting some type of better deal.” These discourses reflect the exhausting burden of proving one’s disability when librarians hold limited and incomplete understandings of disability. Yet, Richard also reinforced the medical model, stating that disability must be diagnosed, referencing the rigorous process he underwent for Social Security benefits.
Internal identity struggles also emerged. Ben said, “I see the person. I don’t see the developmental disability,” yet wore a ‘Lucky Few’ tattoo. He explained it symbolized having three copies of the 21st chromosome rather than the standard two, which is the genetic identifier for Down syndrome. Despite past bullying, he embraced this visible marker of disability pride. Georgina expressed uncertainty: “There’s still a lot of things that I don’t understand,” signaling an ongoing journey with disability identity. Polly, by contrast, said, “I’m happy with sharing,” and emphasized treating people as individuals. These narratives reveal the complexity of disability identity—reflecting deficit and culturally sanctioned assumptions and beliefs about disability—how it is shaped by external judgment, internalized oppression, and the tension between visibility, validation, and self-acceptance.
Management Labor
Patrons described the emotional and social labor involved in navigating library spaces. Three patrons shared the difficulty of asking for help, often tied to anxiety and fear of stigma. April recalled, “I ended up waiting for about five minutes, longer than I’d like to admit, before I finally flagged someone down for assistance,” and yet described feeling like a burden when asking for help. Polly noted, “It’s just hard to approach someone and say hey I need this.” Turner, who identified as an autistic, Mixed-race, asexual male with bipolar disorder and schizoaffective disorder, added that “shame” can be a barrier: “Someone might actually be embarrassed to have a specific need that no one else has.” These experiences reflect the tension between needing support and internalized expectations of independence, tacitly accepting dominant ableist norms.
Power dynamics and scrutiny also shaped patrons’ experiences, who labored to manage others’ expectations and judgments. April described being judged for using accessible parking due to her young appearance. Turner shared, “People think that autism is, like, imaginary. … even my own parents have told me … I was making things up.” This societal skepticism toward non-apparent disabilities contributed to feelings of marginalization and required Turner’s mental labor management of others’ distorted ways of thinking about disability. Ben recalled being judged in special education. Georgina emphasized the need for quiet spaces to manage PTSD. Turner further noted, “People often assume I don’t like them … I am on the autistic spectrum … maybe I do come off as cold,” highlighting the emotional toll of navigating the social misperceptions of librarians and the general public about neurodivergence.
Polly’s account of chronic pain, multiple surgeries, and difficulty with communication and reading emphasized the ongoing physical and mental labor of managing disability. Despite needing help, she hesitated to ask, fearing she was imposing. This reluctance, shared by others, reveals how dominant ableist norms and scrutiny make everyday activities—like visiting the library—emotionally taxing. These narratives underscore the invisible labor disabled patrons perform to access public spaces, manage stigma, and maintain dignity in environments not fully designed for them.
In summary, this analysis of patron experiences found the value of both tailored and inclusive programs and diverse, open-minded staff to foster a sense of community. Accessibility issues, such as appropriate lighting and noise levels, are crucial for accommodating sensory sensitivities. Disabled patrons face challenges in asking for help due to anxiety and societal stigma. This analysis also emphasizes the need to recognize and respect the authenticity of non-apparent disabilities and the emotional labor involved in managing others’ expectations and judgments. Altogether, these discourses present operations of dysconscious ableism – reflecting distorted understandings of disability, accepting the dominant status quo, and promoting inaccessibility and segregated experiences.
Discussion
This paper presents a first of its kind application of critical theory and methods that center the lived experiences of disabled public library patrons. Their experiences in public libraries reveal how dysconscious ableism manifests in everyday interactions and environments. The findings of this paper have focused on four key themes: finding community and belonging, access and comfort seeking, disability authenticity and identity, and management labor. These themes illustrate how disabled patrons navigate systemic barriers and social expectations in public libraries that reinforce exclusion and marginalization.
Disabled patrons often engage in labor to manage others’ discomfort, navigate inaccessible environments, and advocate for their needs. This labor includes emotional and cognitive efforts to avoid being perceived as disruptive or burdensome, to explain one’s disability, or perform normativity (Reeve, 2012). For instance, patrons like April and Georgina felt compelled to justify their presence or behavior to avoid judgment. Such experiences reflect how public library spaces are structured around non-disabled norms, requiring disabled individuals to adapt rather than expecting institutions to be accessible (Gill & Myers, 2024). This labor is a direct consequence of dysconscious ableism, which normalizes exclusion and places the burden of accessibility on the individual rather than the system (Broderick & Lalvani, 2017).
Disabled patrons frequently seek environments that support their sensory, physical, and emotional needs. Quiet spaces, ambient lighting, and clear signage are not luxuries but necessities for many (Muir et al., 2019). Turner’s need for low-stimulation areas to avoid panic attacks and April’s preference for calming environments highlight how standard library settings fail to accommodate neurodivergent and disabled users. CDS calls for universal design practices emphasizing that accessibility should be embedded in the fabric of library services—not treated as an afterthought. Dysconscious ableism is evident when the status quo is that libraries rely on reactive accommodations or ignore the diverse needs of disabled patrons altogether (Broderick & Lalvani, 2017).
The sense of belonging in a library is shaped by how disabled patrons are perceived and treated. Richard’s expertise was dismissed, he believed, due to assumptions about his capacity, while Alice and Georgina faced barriers related to print size and seating comfort. Ben found community through segregated programming, which, while appreciated, underscores the lack of integrated inclusion (Gill & Myers, 2023). Communication barriers and reduced staff availability further alienate disabled patrons, as Polly and Richard noted. These experiences reflect a broader pattern of othering, where disabled individuals are seen as outsiders or burdens. CDS critiques this exclusion, arguing that true inclusion requires not just physical access but cultural and relational belonging (e.g., Gill & Myers; Mingus, 2011). Dysconscious ableism operates here by maintaining environments and practices that signal who is welcome and who is not.
Patrons’ relationships with their disability identities varied. Georgina expressed ambivalence due to her non-apparent disabilities, while Polly embraced transparency. Richard’s frustration with service limitations based on visible impairments points to systemic biases in how disability is recognized and validated. CDS views disability identity as complex and intersectional, shaped by social narratives, personal experiences, and political contexts (Foley, 2024). The lack of recognition for diverse expressions of disability—especially non-apparent or neurodivergent identities—reinforces dysconscious ableism by privileging narrow definitions of disability and ignoring the lived realities of many individuals (Broderick & Lalvani, 2017). Libraries, as public institutions, play a role in either challenging or perpetuating these norms through their policies, services, and staff training.
In sum, across these themes, disabled patrons’ experiences reveal how dysconscious ableism permeates public library spaces. It manifests in the expectation that disabled individuals manage their own inclusion, in environments that fail to support diverse needs, in practices that subtly exclude, and through policies that validate only certain forms of disability. Addressing these issues requires a shift from compliance-based approaches to ones rooted in disability justice and universal design (Mingus, 2011). Libraries must center disabled voices in policy development, proactively design accessible spaces, and challenge ableist norms that hinder equity. Only then can they fulfill their mission as truly public and inclusive institutions (Gill & Myers, 2023).
Conclusion and Future Research
In an era where accessibility is essential to equitable public services, libraries must evolve to meet the diverse needs of all patrons, including those with disabilities. Librarians must foster environments that are not only physically and digitally accessible but culturally affirming and socially supportive. This may be implemented, in part, by reimagining disability as a natural and valuable aspect of human diversity, embracing collective responsibility, ensuring disabled voices and texts are centrally involved in decision-making processes, and designing programs that challenge ableist norms and celebrate disability culture.
But there is a need for further research to understand a wider range of dysconscious ableist experiences among public library patrons and staff with disabilities, who have different disabilities and marginalized identities. For instance, research might better understand how widespread Ben’s sentiments about community and segregated programs are in the disability community and what more inclusive opportunities the library might provide. Additionally, I focused this study in a single county in [Inland] State including a mid-sized city. There is a need for comparative work in other regions such as with greater rural and urban environments. Additional data could further contextualize the findings of this study through observations of how librarians conduct their practices. As a framework for understanding the experiences of disabled patrons and staff, much is yet to be understood about the operation and effects of dysconscious ableism in the public library.
Acknowledgements
I am deeply grateful to my Lead Pipe editors, Jaena Rae Cabrera, Jessica Schomberg, and Morgan Rondinelli, whose insightful feedback greatly enriched this article. I also extend my sincere thanks to my colleagues J.J. Pionke, Leah Dudak, and Carrie Murawski for their thoughtful suggestions on early drafts, which played a key role in shaping the piece and making it a strong fit for Lead Pipe.
References
Adesina, O.F., Saliu, U.A. & Ambali, Z.O. (2018). An assessment of the resources and services provision for the disabled library users in University of Ilorin and Federal College of Education (Special) Oyo. Library Philosophy & Practice, May, e1818-1842.
Adkins, D. & Bushman, B. (2015). A special needs approach: A study of how libraries can start programs for children with disabilities. Children & Libraries, 13(3), 28-33. https://doi.org/10.5860/cal.13n3.28
Ali, S. (2022, March 15). Female-dominated careers pay less as gender gap persists. The Hill. https://thehill.com/changing-america/respect/equality/598337-female-dominated-careers-pay-women-lower-wages-than-men-as/
Anderson, A. (2018). Autism and the academic library – a study of online communication. College & Research Libraries, 79(5), 645-658.
Anderson, A., & Phillips, A. L. (2021). Makerspaces designed for all: Creating equitable and inclusive learning environments in libraries. Proceedings of the Association for Information Science and Technology, 58(1), 806–807. https://doi.org/10.1002/pra2.569
Beegly, E. & Madva, A. (2020). Introducing implicit bias: Why this book matters. In E. Beegly & A. Madva (Eds.), An introduction to implicit bias: Knowledge, justice, and the social mind (pp. 1-19). New York, NY: Routledge.
Bohonos, J.W. (2019). Including critical whiteness studies in the critical human resource development family: A proposed theoretical framework. Adult Education Quarterly, 69(4) 315-337.
Broderick, A. & Lalvani, P. (2017). Dysconscious ableism: Toward a liberatory praxis in teacher education. International Journal of Inclusive Education, 21(9), 894-905, DOI: 10.1080/13603116.2017.1296034
Carey, E. & Griffiths, C. (2017). Recruitment and consent of adults with intellectual disabilities in a classic grounded theory research study: Ethical and methodological considerations. Disability & Society, 32(2), 193-212.
Diem, S., Young, M.D., Welton, A.D., Mansfield, K.C., & Lee, P. (2014). The intellectual landscape of critical policy analysis. International Journal of Qualitative Studies in Education, 27(9), 1068-1090.
Dirth, T.P. & Adams G.A. (2019). Decolonial theory and disability studies: On the modernity / coloniality of ability. Journal of Social and Political Psychology, 7(1), 260-289.
Ettarh, F. (2018, January 10). Vocational awe and librarianship: The lies we tell ourselves. In the Library with the Lead Pipe. https://www.inthelibrarywiththeleadpipe.org/2018/vocational-awe/
Farrugia, P. (2022). Recruitment of Indigenous study participants in Canada: Obligations or constraints? An ethical reflection. Canadian Journal of Bioethics, 5(2), 100-106.
Foley, A. (2024). Understanding technology access for people with intellectual disability through Participatory Action Research. In J. Seale, J. (Ed.), A research agenda for disability and technology (pp. 61-84). Elgaronline.
Gill, M. & Myers, B. (2023). Introduction: Recognizing student voice in inclusive higher education. In M. Gill and B. Myers (Eds.), Creating our own lives., xi-xxxi. University of Minnesota Press.
Gibson, A.N. & Martin, J.D. III (2019). Re-situating information poverty: Information marginalization and parents of individuals with disabilities. Journal of the Association for Information Science & Technology, 70(5), 476-487.
Graves, S.J. & German, E. (2018). Evidence of our values: Disability inclusion on library instruction websites. Portal: Libraries & the Academy, 18(3), 559-574.
Gulati, S., Paterson, M., Medves, J. & Luce-Kapler, R. (2011). Adolescent group Empowerment: Group-centered occupations to empower adolescents with disabilities in the urban slums of north India. Occupational Therapy International, 18(2), 67-84.
Harding, R. (2021). Doing research with intellectually disabled participants: Reflections on the challenges of capacity and consent in socio-legal research. Journal of Law and Society, 48(Suppl. 1), S28–S43. https://doi.org/10.1111/jols.12331
Hathcock, A. (2015, October 7). White librarianship in blackface: Diversity initiatives in LIS. In the Library with the Lead Pipe. https://www.inthelibrarywiththeleadpipe.org/2015/lis-diversity/
Institute of Museum & Library Services (“IMLS”). (2021). Understanding the social wellbeing impacts of the nation’s libraries and museums: 2021 report. https://www.imls.gov/sites/default/files/2021-10/swi-report.pdf
Kafer, A. (2013). Feminist, queer, crip. Bloomington: Indiana University Press.
Kimura, A.K. (2018). Defining, evaluating, and achieving accessible library resources. Reference Services Review, 46(3), 425-438.
King, J. (1991). Dysconscious racism: Ideology, identity, and the miseducation of teachers. Journal of Negro Education, 60(2), 133-146.
Kleynhans, S.A. & Fourie, I. (2014). Ensuring accessibility of electronic information resources for visually impaired people. Library Hi Tech, 32(2), 368-379.
Lawton, S. (2018, March 5). Reflections on gender oppression and libraries. Public Libraries Online. https://publiclibrariesonline.org/2018/03/reflections-on-gender-oppression-and-libraries/
Liu, Y. Q., Bielefield, A., & McKay, P. (2019). Are urban public libraries websites accessible to Americans with Disabilities? Universal Access in the Information Society, 18(1), 191–206. https://doi.org/10.1007/s10209-017-0571-7
Loyer, J. (2018). Indigenous information literacy: Nêhiyaw kinship enabling self-care in research. In K.P. Nicholson & M. Seale (Eds.). The politics of theory and the practice of critical librarianship (pp. 145-156). Sacramento, CA: Library Juice Press.
Madison, D.S. (2012). Critical ethnography: Method, ethics, and performance (2nd Ed.). Los Angeles, CA: Sage Publications.
Matthews, A. (2021). Reversing the gaze on race, social justice, and inclusion in public librarianship. Education for Information, 37(2), 187-202.
McCabe, J. & Holmes, D. (2013). Nursing, sexual health and youth with disabilities: A critical ethnography. Journal of Advanced Nursing, 70(1), 77-86.
Meekosha, H., & Shuttleworth, R. (2009). What’s so ‘critical’ about critical disability studies? Australian Journal of Human Rights, 15(1), 47–76. https://doi.org/10.1080/10282580701850330
Muir, R., Thompson, K. M., & Qayyum, A. (2019). Considering “atmosphere” in facilitating information seeking by people with invisible disabilities in public libraries. Proceedings of the Association for Information Science and Technology, 56(1), 216–226. https://doi.org/10.1002/pra2.17
Myhill, W. (in press). The Operation of Dysconscious Ableism in Public Librarianship. Library Quarterly.
Okun, T. (2021). White supremacy culture – still here. Retrieved Jan. 6, 2024, from https://drive.google.com/file/d/1XR_7M_9qa64zZ00_JyFVTAjmjVU-uSz8/view
Ortlieb, R., Glauninger, E. & Weiss, S. (2021). Organizational inclusion and identity regulation: How inclusive organizations form ‘Good’, ‘Glorious’ and ‘Grateful’ refugees. Organization, 28(2), 266-288.
Oud, J. (2018). Academic librarians with disabilities: Job perceptions and factors influencing positive workplace experiences. Partnership: The Canadian Journal of Library and Information Practice & Research, 13(1), 1-30.
Reeve, D. (2012). Psycho-emotional disablism in the lives of people experiencing mental distress. In J. Anderson, B. Sapey & H. Spandler (Eds.), Distress or disability? Proceedings of a symposium held at Lancaster Disability, 15-16 November 2011 (pp. 24-29). Centre for Disability Research, Lancaster University.
Ren, X. (2013). New York state public library systems and their services. Public Library Quarterly, 32(1), 46-67.
Rokay, M. (2021). Critical ethnography as an archival tool: A case study of the Afghan diaspora in Canada. Archivaria: The Journal of the Association of Canadian Archivists, 91(June), 176-201.
Rosa’s Law. (2010, Oct. 5). Public Law 111–256, 124 Stat. 2643.
Sambo, A.S., Rabiu, N. & Shaba, A.A. (2016). Physically challenged students and their information needs. Library Philosophy and Practice, Summer(1), 1461-1475.
Schomberg, J. (2018). Disability at work: Libraries, built to exclude. In K.P. Nicholson & M. Seale (Eds.). The politics of theory and the practice of critical librarianship (pp. 116-127). Sacramento, CA: Library Juice Press.
Smith, M. & Patin, B.J.H. (2024). Giving voice through reparative storytelling: correcting racist epistemic injustices in LIS. Library Quarterly,94(4) 441–457.
Stack, E.E. & McDonald, K.E. (2018). We are “both in charge, the academics and self-advocates”: Empowerment in community-based participatory research. Journal of Policy & Practice in Intellectual Disabilities, 15(1), 80-89.
Tervalon, M. & Murray-Garcia, J. (1998). Cultural humility versus cultural competence: A critical distinction in defining physician training outcomes in multicultural education. Journal of Health Care for the Poor and Underserved, 9(2), 117-125.
United Nations Educational, Scientific and Cultural Organization (“UNESCO”) & International Federation of Library Associations and Institutions (“IFLAI”). (2022). IFLA-UNESCO public library manifesto 2022. https://unesdoc.unesco.org/ark:/48223/pf0000385149
Vincent, B.W. (2018). Studying trans: Recommendations for ethical recruitment and collaboration with transgender participants in academic research. Psychology & Sexuality, 9(2), 102-116, https://doi.org/10.1080/19419899.2018.1434558
Wagner, T.L. & Crowley, A. (2020). Why are bathrooms inclusive if the stacks exclude? Systemic exclusion of trans and gender nonconforming persons in post-Trump academic librarianship. Reference Services Review, 48(1), 159-181.
Wheeler, J. (2021). “How much is not enough?”: Public library outreach to “disadvantaged” communities in the war on poverty. Library Quarterly: Information, Community, Policy, 91(2), 190-208.
Yoon, K., Dols, R., Hulscher, L., Newberry, T. (2016). An exploratory study of library website accessibility for visually impaired users. Library & Information Science Research, 38(3), 250-258.
Footnotes
Ben receives services from and participates in the programs of [Agency]. ︎
Polly previously was employed by [Social Service]. ︎
This report delves into the mechanics of the Internet Archive with the precision of a teardown. We will strip back the chassis to examine the custom-built PetaBox servers that heat the building without air conditioning. We will trace the evolution of the web crawlers—from the early tape-based dumps of Alexa Internet to the sophisticated browser-based bots of 2025. We will analyze the financial ledger of this non-profit giant, exploring how it survives on a budget that is a rounding error for its Silicon Valley neighbors. And finally, we will look to the future, where the "Decentralized Web" (DWeb) promises to fragment the Archive into a million pieces to ensure it can never be destroyed.
It is long, detailed, comprehensive and well worth reading in full. Below the fold I comment on the part about storage.
This picture shows Brewster Kahle with the Internet Archive's very first storage, tape drives holding crawls from Alexa Internet, the Web traffic analysis company founded by Brewster and Bruce Gilliat in 1996 and, three years later, acquired by Amazon for $250M.
The first custom-designed Internet Archive storage system was version 1 of the PetaBox, a vividly red-painted 1U system introduced in 2004. This picture shows a rack of them. I'm familiar with them because the LOCKSS Program used them for some years.
The first PetaBox rack, operational in June 2004, was a revelation in storage density. It held 100 terabytes (TB) of data—a massive sum at the time—while consuming only about 6 kilowatts of power. To put that in perspective, in 2003, the entire Wayback Machine was growing at a rate of just 12 terabytes per month.
The LOCKSS Program eventually transitioned to 4U systems similar to those then in use at Backblaze. Around the same time the Archive also moved to 4U systems for their PetaBox.
The fourth-generation PetaBox, introduced around 2010, exemplified this density. Each rack contained 240 disks of 2 terabytes each, organized into 4U high rack mounts. These units were powered by Intel Xeon processors (specifically the E7-8870 series in later upgrades) with 12 gigabytes of RAM. The architecture relied on bonding pair of 1-gigabit interfaces to create a 2-gigabit pipe, feeding into a rack switch with a 10-gigabit uplink.10
Over time older, smaller drives were phased out and replaced by newer, bigger drives:
By 2025, the storage landscape had shifted again. The current PetaBox racks provide 1.4 petabytes of storage per rack. This leap is achieved not by adding more slots, but by utilizing significantly larger drives—8TB, 16TB, and even 22TB drives are now standard. In 2016, the Archive managed around 20,000 individual disk drives. Remarkably, even as storage capacity tripled between 2012 and 2016, the total count of drives remained relatively constant due to these density improvements.
This is indeed an impressive strory and Li writes:
The trajectory of the PetaBox is a case study in Moore's Law applied to magnetic storage.
Here I have to correct Li. Moore's Law applies to silicon such as solid-state storage; it is Kryder's Law that applies to magnetic storage such as the hard disks in the PetaBox.
The Archive's primary data center is located in the Richmond District of San Francisco, a neighborhood known for its perpetual fog and cool maritime climate. The building utilizes this ambient air for cooling. There is no traditional air conditioning in the PetaBox machine rooms. Instead, the servers are designed to run at slightly higher operational temperatures, and the excess heat generated by the spinning disks is captured and recirculated to heat the building during the damp San Francisco winters.
This "waste heat" system is a closed loop of efficiency. The 60+ kilowatts of heat energy produced by a storage cluster is not a byproduct to be eliminated but a resource to be harvested. This design choice dramatically lowers the Power Usage Effectiveness (PUE) ratio of the facility, allowing the Archive to spend its limited funds on hard drives rather than electricity bills.
In the unlikely, for San Francisco, event that the day is too hot, less-urgent tasks can be delayed, or some of the racks can have their clock rate reduced, disks put into sleep mode, or even be powered down. Redundancy means that the data will be available elsewhere.
The Archive has followed this advice for a long time, as Li explains:
With over 28,000 spinning disks in operation, drive failure is a statistical certainty. ...
The PetaBox software is designed to be fault-tolerant. Data is mirrored across multiple machines, often in different physical locations (including data centers in Redwood City and Richmond, California, and copies in Europe and Canada).12 Because the data is not "mission-critical" in the sense of a live banking transaction, the Archive can tolerate a certain number of dead drives in a node before physical maintenance is required.
Replacing one drive takes about 15 minutes of work. If we have 30,000 drives and 2 percent fail, it takes 150 hours to replace those. In other words, one employee for one month of 8 hour days. Getting the failure rate down to 1 percent means you save 2 weeks of employee salary - maybe $5,000 total? The 30,000 drives costs you $4m.
The basic point I was making was that even if we ignore all the evidence that we can't, and assume that we could actually build a system reliable enough to preserve a petabyte for a century, we could not prove that we had done so. No matter how easy or hard you think a problem is, if it is impossible to prove that you have solved it, scepticism about proposed solutions is inevitable.
We have to assume that, despite their best efforts, the Archive will over time lose some data. This isn't a problem for two reasons:
The Archive's collection is, fundamentally, a sample of cyberspace. Stuff missing is vastly more likely to be because it wasn't collected than because it was collected but subsequently lost.
Driving the already low probability of loss down further gets exponentially more expensive. The more of the Archive's limited resources is devoted to doing so, the less can be devoted to collecting and storing more stuff. Thus devoting more to eliminating data loss results in less data surviving.
Since at least 2011 I have written repeatedly about the fact that preserving data for the long term is and economic, not a technical problem. With a lavish budget it is simple; the smaller the budget the harder it gets. Li correctly points out that the Archive's budget, in the range of $25-30M/year, is vastly lower than any comparable website:
By owning its hardware, using the PetaBox high-density architecture, avoiding air conditioning costs, and using open-source software, the Archive achieves a storage cost efficiency that is orders of magnitude better than commercial cloud rates.
Consider the cost of storing 100 petabytes on Amazon S3. At standard rates (~$0.021 per GB per month), the storage alone would cost over $2.1 million per month. The Internet Archive’s entire annual operating budget—for staff, buildings, legal defense, and hardware—is less than what it would cost to store their data on AWS for a year.
First, Li ignores bandwidth charges, which as one of the most-visited sites on the Web would dwarf the storage charges. Second, Li compares S3, intended for and priced as instantly accessible, replicated data for the back-end of mission-critical online services, with the Archive's storage, intended for the long-term storage of data, most of which is accessed very rarely. Amazon has products aimed at this market. As an example, writing a Petabyte to Amazon Glacier, storing it for a decade, and then reading it out at last year's prices would cost just under $160K. This too is a misleading comparison, Glacier is intended for archival data that has a much lower probability of access than the Archive's.
The key to making storage affordable is tiering, moving data that hasn't been accessed recently down the storage hierarchy to cheaper media. Kestutis Patiejunas gave an excellent talk about this back in 2014. I discussed it in More on Facebook's "Cold Storage". Facebook was in the happy position of having an extremely accurate model of the access patterns to each of the small number of data types they stored, so could do an very good job of matching the data to the performance of the layer in their storage hierarchy that held it. Their expectation was that the primary reason data in the lowest layer would be accessed was that it had been subpoenaed.
Figure 1: Two extreme time zones – Baker Island (UTC-12:00) and Line Islands (UTC+14:00), adapted fromInternational Date Line, Wikipedia.
The International Date Line divides the world into multiple time zones. Initially, the idea was to divide the globe into 24 longitudinal slices, each about 15° wide. Theoretically, this would give us 24 time zones, each with a one-hour difference, defined by an offset from a reference time, the Coordinated Universal Time (UTC). In actuality, there are more than 24 time zones. Some regions use half-hour or even quarter-hour offsets rather than full hours - for example, Nepal (UTC+5:45). In reality, time zones extend beyond 15° longitude because of political reasons, governance, economic aspects, geographical boundaries, and other conveniences. As a result, there are currently a total of 38 time zones.
Extreme Time Zones, Side by Side
The International Date Line is not a perfect straight line; rather it is a zig-zag to keep some regions within the same time zone. Figure 1 shows the part of the world’s map where we can see Baker Island and the Line Islands are geographically close to each other, but opposite to the International Date Line. This causes the two regions to be furthest apart in time, though being neighbours. Baker Island is located in the far east – world’s furthest behind time zone (UTC-12:00) and Line Islands is located in the far west – world’s furthest forward time zone (UTC+14:00). This makes Line Islands the first place on Earth to begin the next day and Baker Island the last place on Earth to end a day. Thus, the time distance between these two extreme time zones is 26 hours.
Across countries, languages, and platforms, UTC provides a single baseline for all timestamps. This is an essential choice for computer science and international standards. End-user applications localize time based on one’s device or account settings while back-end systems standardize timekeeping using UTC to eliminate ambiguity. Thus, end-user applications, like Twitter, Facebook, or email clients, typically display the time in the local timezone. However, all web archives use UTC time (i.e., 14-digit datetime) to avoid time zone confusion. Time zone offsets are primarily applied for human readability on the front-end UI and not for storing or indexing.
Estimating an Archival Time Window using Time Zone Offsets
Figure 2: A tweet posted by @randyhillier, who later deleted it.
Figure 2 shows a tweet originally posted by @randyhillier, who later deleted his tweet, and thus is no longer on the live web. However, we can search in the web archives to see if the tweet was archived. To search for the tweet in the web archives, we need to make a reasonable estimate of the earliest possible time the tweet could have been archived.
The timestamp (9:41 PM Feb 19, 2022) shown in the screenshot in Figure 1 reflects the timezone of the person who took the screenshot. However, the timezone of the user that took the screenshot (the "viewer") is not necessarily the same timezone as the original poster (or "author", in this case @randyhillier). Let us consider a scenario where the viewer and the author are at two extreme time zones. The timestamp on the screenshot "Feb 19, 2022 9:41 PM" is in the time zone of the viewer who took the screenshot. If the viewer is in the UTC+14 time zone and the author is in the UTC-12 time zone, then the author’s timestamp of the tweet would be 26 hours behind the viewer’s timestamp (Figure 3 - top). Similarly, if the time zones are swapped between viewer and author, the author’s timestamp of the tweet would be 26 hours before the viewer’s timestamp (Figure 3 - bottom).
Figure 3: Determining a reasonable estimate of the earliest archival time of a tweet to search in the web archives.
As a result, the archival time window for the alleged author’s tweet could be estimated as ±26 hours from the screenshot timestamp. Therefore, it would be reasonable to use a left-hand boundary of 26 hours before the screenshot timestamp for searching in the web archive. Since a URL cannot be archived before it exists, we can eliminate all URLs archived earlier than the timestamp in the screenshot, minus 26 hours. We do not limit the right-hand boundary since early posts may be archived at later times.
The following curl command shows the total number of tweets archived when we query the Wayback Machine’s CDX API using only a Twitter handle. The CDX response results in 36,772 tweets for @randyhillier's status URLs.
Figure 4: Using the CDX API to retrieve the total number of tweets archived for a user using the Twitter handle.
The next curl command shows the total number of tweets archived when we query the Wayback Machine’s CDX API using a left-hand boundary of 26 hours before the screenshot timestamp along with the Twitter handle. The CDX response results in 16,258 tweets for @randyhillier's status URLs which were archived 26 hours before (7:41 PM Feb 18, 2022) the screenshot timestamp (9:41 PM Feb 19, 2022).
Figure 5: Using the CDX API with a left-hand boundary along with the Twitter handle to limit the search space.
Thus, the total number of archived tweets required to individually dereference is reduced by over half when a left-hand boundary is used along with the Twitter handle.
Summary
It is natural to assume the time difference across the globe is a maximum of 24 hours. However, for geopolitical reasons the global time range is actually 26 hours. We use the range between two extreme points on Earth to estimate an archival time window for a tweet in the screenshot, thereby often allowing us to reduce the number of archived tweets that have to be individually dereferenced.
Eight courses from the Web Science and Digital Libraries (WS-DL) Group will be offered for Spring 2026. The classes will be a mixture of on-line synchronous, asynchronous, and f2f.
CS 432/532 Web Science, Ms. Nasreen Muhammad Arif, asynchronous Topics: Python, R, D3, ML, and IR.
CS 620 Intro to Data Science & Analytics, Dr. Bhanuka Mahanama, Web, Tuesdays & Thursdays 6:00-7:15 and asynchronous (8 week session starting in October) Topics: Python, Pandas, NumPy, NoSQL, Data Wrangling, ML, Colab.
CS 625 Data Visualization, Dr. Bhanuka Mahanama, Tuesdays & Thursdays 1:30-2:45 Topics: Tableau, Python Seaborn, Matplotlib, Vega-Lite, Observable, Markdown, OpenRefine, data cleaning, visual perception, visualization design, exploratory data analysis, visual storytelling
CS 732/832 Human Computer Interaction, Dr. Bhanuka Mahanama, Tuesdays 4:30-7:10 Topics: Cognitive and social phenomena surrounding human use of computers.
CS 733/833 Natural Language Processing, Dr. Vikas Ashok, asynchronous Topics: Language Models, Parsing, Word Embedding, Machine Translation, Text Simplification, Text Summarization, Question Answering
CS 734/834 Information Retrieval, Dr. Santosh Nukavarapu, Tuesdays 4:30-7:10 Topics: crawling, ranking, query processing, retrieval models, evaluation, clustering, machine learning.
The Fall 2026 semester is still undecided, but will likely be similar to the previous Fall semesters. Previous course offerings: F25, S25, F24, S24, F23, S23, F22, S22, F21, S21, F20, S20, F19, S19, and F18.
This post was written by Hassna Ramadan, who attended the 2025 DLF Forum as the HBCU Students and Workers Fellow. The views and opinions expressed in this blog post are solely those of the author and do not necessarily reflect the official policy or position of the Digital Library Federation or CLIR.
Hassna Ramadan is the Digital Innovation & Access Services Librarian and Assistant Professor at Alabama State University’s Levi Watkins Learning Center, leading digitization, metadata, and access initiatives. Her work promotes equitable, user-centered digital collections that enhance access to HBCU history and culture. A 2025 DLF Forum Fellow, she is pursuing an Ed.D. in Applied Learning Sciences at the University of Miami and holds an MLIS from the University of Washington.
At Alabama State University’s Levi Watkins Learning Center, I spend my days living at the intersection of digitization, metadata, and access, trying to make sure our digital collections don’t just exist online, but actually reach the people who need them. As a Fellow at the 2025 DLF Forum, I expected to pick up practical ideas (and I did), however what I didn’t expect was how clearly one message would thread itself through so many conversations: digital work is people work, and safety and care have to be designed, not assumed.
That theme landed for me during the opening plenary with Dr. KáLyn Coghill, “Your Silence Will Not Protect You: A Clarion Call to Make Online Protection the Rule and NOT the Exception.” Dr. Coghill’s “Digital Community Garden” metaphor stayed with me because it shifts the question away from individual survival tactics (“just delete the app,” “ignore it,” “log off”) and toward collective responsibility. In a garden, the healthiest plants don’t thrive because they’re tough, they thrive because someone is paying attention. Someone is noticing harm early, naming what’s happening, and taking action to protect the space.
That framing made me think differently about the digital spaces I help shape at ASU. When we build digitization workflows, write metadata guidance, or design user interfaces, we’re also setting norms: what gets named, what gets hidden, what gets prioritized, and who feels welcome, or surveilled, when they arrive. “Online” isn’t separate from “real life.” The decisions we make about description, search, and access ripple outward into the offline world: who is visible, who is protected, and who is exposed.
I heard echoes of that in sessions on reparative metadata and harmful content statements. The conversation wasn’t simply “remove bad terms” (though sometimes that’s necessary). It was about giving users agency, documenting the iterative nature of description, and being honest about what harm looks like in both collections and metadata. If we want people to trust our collections, we can’t pretend neutrality protects anyone. We have to make our choices visible, explain our intent, and create pathways for repair.
I left DLF thinking less about new tools and more about presence, about noticing harm, naming it, and refusing to treat it as inevitable. Digital stewardship, at its best, is an act of care: care for people, for history, and for the futures our collections make possible. That care shows up in small, cumulative choices, and those choices are what ultimately determine whether our digital spaces can sustain trust.
DLF Forum 2025 reminded me that digital stewardship isn’t only about preservation and access. It’s also about sustenance, security, and care. And if we want our collections, and our communities, to last, we have to tend the garden together.
What good is life without music. But that’s impossible, one
shuffle has always led to another. One man hears it start on his
lathe, a mother beats her eggs. There’s a typewriter in the
next room. Two cars are angry at each other. The baby
downstairs is wet again. I remember the voice of a dead
friend. Everything speaks at the same time. Music will watch
us drown.
I write letters to all those from whom I receive and to many of
those from I don’t. I read books, anything, useless piles of
random isufferable rubbish for which, in my torpid panic, I
fall through time and space each day in my foolish way,
remembering only the present feeling, not the village with its
face of death nothing to be carried secretly in a car.
This is a guide brewed from conversations with initiatives in London
(UK), Berlin (DE), Prague (CZ), Philadelphia (USA), Rotterdam (NL),
Vienna (AT), Lutruwtia (Tas/AU), County Mayo (IE) and a community from
Middle America gathering on servers. This text can support you when
starting a permacomputing collective. We use fermenting as a metaphor.
It isn’t a strict recipe but more of a loose framework that can be
freely modified to suit local tastes and conditions. Many actions are
cyclical and can be seen as opportunities to revisit or re-purpose
later.
located at 311 North 20th Street (at Wood Street), one block north of
the Ben Franklin Parkway, directly behind the Central Library on Logan
Square and just five minutes from Routes 95 and 76 - is a used bookstore
staffed by a team of paid and volunteer booksellers that offers gently
used, publicly donated books, records, CDs at reduced prices. Now the
new home of Chris’ Kids Corner for children’s books and story hours,
they also feature an eclectic stock of fiction, non-fiction,
contemporary, classics, out of print, first editions, art, architecture
and crafts.
Le Sommet pour l’action sur l’intelligence artificielle se tient à Paris
du 6 au 11 février 2025. C’est l’occasion de rappeler l’existence d’une
boîte à outils pour révéler les angles morts des discours sur le
numérique. Autour du concept d’« impensé numérique », ces outils de
compréhension sont précieux pour garder la tête froide face à
l’irruption de l’IA générative dans notre quotidien.
We analyzed 470 open-source GitHub pull requests, including 320
AI-co-authored PRs and 150 human-only PRs, using CodeRabbit’s structured
issue taxonomy. Every finding was normalized to issues per 100 PRs and
we used statistical rate ratios to compare how often different types of
problems appeared in each group.
The results? Clear, measurable, and consistent with what many developers
have been feeling intuitively: AI accelerates output, but it also
amplifies certain categories of mistakes.
Father Mother Sister Brother is a 2025 comedy-drama anthology film
written and directed by Jim Jarmusch. It follows three estranged family
relationships in three different countries around the world, starring an
ensemble cast that includes Tom Waits, Adam Driver, Mayim Bialik,
Charlotte Rampling, Cate Blanchett, Vicky Krieps, Sarah Greene, Indya
Moore, and Luka Sabbat.
Columnar storage formats are the foundation for modern data analytics
systems. The proliferation of open- source file formats (i.e., Parquet,
ORC) allows seamless data sharing across disparate platforms. However,
these formats were created over a decade ago for hardware and workload
environments that are much different from today. Although these formats
have incorporated some updates to their specification to adapt to these
changes, not all deployments support those modifications, and too often
systems cannot overcome the formats’ deficiencies and limitations
without a rewrite. In this paper, we present the F uture-proof F ile
Format (F3) project. It is a next-generation open-source file format
with interoperability, extensibility, and efficiency as its core design
principles. F3 obviates the need to create a new format every time a
shift occurs in data processing and computing by providing a data
organization structure and a general-purpose API to allow developers to
add new encoding schemes easily. Each self-describing F3 file includes
both the data and meta-data, as well as WebAssembly (Wasm) binaries to
decode the data. Embedding the decoders in each file requires minimal
storage (kilobytes) and ensures compatibility on any platform in case
native decoders are unavailable. To evaluate F3, we compared it against
legacy and state-of-the-art open-source file formats. Our evaluations
demonstrate the efficacy of F3’s storage layout and the benefits of
Wasm-driven decoding.
Tsing and Zhou instead prefer to describe FUNGI: Anarchist Designers as
an exhibition of ‘anti-design’. In this show, fungi are not passive
building materials, but rather anarchic co-designers – unconscious and
uncontrollable – of a world that can only exist through alliances
between humans and other living things. The exhibition reveals how fungi
manifest themselves at different scales, from sick frogs and the
dishwasher in your kitchen, to hospital beds, termite mounds, the human
digestive system, coffee, banana and conifer plantations, and the
jungle.
Here’s what I keep coming back to: in any mature system, most of the
graph will be memories of memories. You ask me my favorite restaurants,
I think about it, answer, and now “that list I made” becomes its own
retrievable thing. Next time someone asks about dinner plans, I don’t
re-derive preferences from first principles. I remember what I concluded
last time. Psychologists say this is how human recall actually works;
you’re not accessing the original, you’re accessing the last retrieval.
Gets a little distorted each time.
In 2023, I returned to Taiwan for further social science research
focused on environmental activism in response to the pollution caused by
Formosa Plastics, one of the biggest plastics companies in the world,
headquartered in Taiwan. One thread of research upon my return extended
an initiative that I’ve come to call “Archiving Formosa Plastics”,
designed to study environmental justice and governance issues related to
the company across diverse settings, supporting various research,
advocacy, and teaching endeavours.
The project started after getting to know an anti-Formosa activist in
Texas named Diane Wilson. Since the Texas Formosa Plant started
operations in the late 1980s, Wilson has collected many kinds of
documents about the plant, eventually needing a large barn to store them
all. I had many questions about these documents: When and how did these
various documents gain and lose political value? Who would take care of
and steward these documents into the future
A couple of days ago I wrote about ActivityPub becoming a W3C
Recommendation. This was one output of the Social Working Group, and the
blogpost was about my experiences, and most of my experiences were on my
direct work on ActivityPub. But the Social Working Group did more than
ActivityPub; it also on the same day published WebSub, a useful piece of
technology in its own right which amongst other things also plays a
significant historical role in what is even ActivityPub’s history (but
is not used by ActivityPub itself), and it has also published several
documents which are not compatible with ActivityPub at all, and appear
to play the same role. This, to outsiders, may appear confusing, but
there are reasons which I will go into in this post
We are part of a growing global effort to ensure innovative technologies
serve Indigenous communities and their environmental priorities. As AI
rapidly becomes even more ubiquitous, Western science should look to
Indigenous experts to guide the development of ethical AI tools for
conservation in ways that assert their own goals, priorities and
cautions.
Responsible AI that benefits Indigenous communities and conservation
must implement Indigenous data sovereignty principles, and determine how
and if Indigenous traditional ecological knowledge should be
incorporated into these systems. AI that is co-designed with Indigenous
partners, rather than for them, can make these technologies more
accessible, culturally appropriate and aligned with community goals
A critical review of Generative AI for Indigenous-focused organizations,
governments, and anyone who wants to better understand and protect their
rights and privacy.
Tramas is an action-oriented research project of the Decolonial Feminist
Coalition for Digital and Environmental Justice. By examining case
studies and testimonies of resistance across Latin America, we aim to
show how the digital technology production chain has a wide range of
socio-environmental impacts on communities and their territories.
All the “Discord-only” communities that currently exist will likely
disappear, however. And unlike all the dead phpBB forums that nobody
uses anymore but are still up for now, dead Discord communities will
never appear on the Wayback Machine. A decade or more of the internet’s
history gone. Sure, you can’t easily google search the Wayback Machine,
but at least it still exists somewhere. Discords? Truly lost forever.
Entire hobby communities that spent years of work discussing things,
answering questions, a wealth of information… gone.
Indigenous math isn’t just about numbers and equations, it involves
culture, spirituality and more. Math professor Edward Doolittle, a
Mohawk from Six Nations in Ontario, sees math as something embedded in
Creation itself. In his Hagey Lecture at the University of Waterloo, he
describes Indigenous mathematics as being grounded in cognition,
emotion, the physical world and community. Indigenizing math, Doolittle
hopes, will make it more approachable and meaningful to Indigenous
students — show them how entwined it is with everyday life and something
much bigger than ourselves
The Man Who Knew Infinity is a 2015 British biographical drama film
about the Indian mathematician Srinivasa Ramanujan, based on the 1991
book of the same name by Robert Kanigel.
While AI is undeniably good at writing code, it remains poor at
architecting maintainable, distributable, and scalable systems. This is
where non-technical leaders who think they can fire their development
teams are making a significant mistake. Until we see the arrival of an
artificial intelligence that renders this entire discussion moot,
believing that technical expertise can be replaced by a prompt is a
strategic error. Building robust software still requires a human who
understands the underlying principles of the craft.
Now we are faced with the conundrum of figuring out which ones will
manage to reach broad adoption in the ecosystem. From where I’m standing
it seems easier to contribute the missing bits to Parquet and build
those systems on top. These formats prove that these techniques work. We
can get much better performance by applying new approaches. As a
community, we should take a hint and evolve what we have
But like said: the whenwords library contains no code. Instead,
whenwords contains specs and tests, specifically:
SPEC.md: A detailed description of how the library should behave and how
it should be implemented. tests.yaml: A list of language-agnostic test
cases, defined as input/output pairs, that any implementation must pass.
INSTALL.md: Instructions for building whenwords, for you, the human.
Bitcoin’s proof-of-work algorithm has a difficulty ratchet to keep production steady. Network difficulty adjusts every two weeks, approximately, based on whether miners have been finding new blocks for the blockchain too quickly or too slowly.
Difficulty tightens when a higher bitcoin price is encouraging miners to join the market, that much makes sense. But when a lower bitcoin price is squeezing margins and pushing the least efficient miners out, shouldn’t difficulty fall?
Maybe difficulty lags behind the price? As said above, the ratchet only adjusts approximately every two weeks. Total hashrate offers a more dynamic measure of power deployed to the network, albeit an estimated one based on how long it’s taking to mine a block. Any change in market structure might show up there first.
And has it? Not really:
The first thing to note is that, depending upon power costs and where they are in the queue for the latest rigs from Bitmain, miners margins vary greatly. So Elder is right that, if one of the two-week adjustemnts increases the difficulty, some of the least economic rigs should be switched off. In theory, if the adjustment decreases the difficulty, some of these idled rigs should be switched back on.
Eyeballing the graph, between early July and late October the price was between $110K and $120K, a 9% range. During that period the difficulty increased from around 140trn to around 155trn, about an 11% range. These aren't big changes, but it appears a bit strange that roughly flat price coincides with a steady-ish increase in difficulty.
Do miners with sunk costs keep running on negative margins in the hope of getting lucky? Are a handful of big miners, maybe advantaged by free power or whatever, keeping difficulty high to drive out competitors, either inadvertently or as part of some devious plan to centralise production and control the network? Or has mining become 55 per cent more efficient since last November?
I estimate that during that time Bitmain and its competitors shipped an additional 1000EH/s to the miners, over and above the new rigs replacing obsolete ones. These leading-edge rigs would have been turned on immediately. During that time the hash rate rose from about 870EH/s to around 1120EH/s, or about 250EH/s. So around 150EH/s must have represented idled, less-efficient rigs being turned on. At the start of the period at most 85% of the rig fleet was working. At the end of the period, as the price started to fall, the most efficient miners had about 100EH/s more than they did at the beginning.
In the subsequent 2 months the price dropped from about $120K to around $85K and the hash rate dropped from around 1120EH/s to around 1060EH/s, or by 60EH/s. But in that time there ws an incremental 50EH/s of new rigs. So 110EH/s of the 150EH/s from the originally idle fleet of uneconomic rigs were turned off. This within the margin or error of my back-of-the-envelope estimates.
My take is that what happened was what should have been expected. Elder's view was too simplistic, and he was misled by (a) the noise in the graph, and ((b) the fact that the Y axis doesn't start at zero, making the noise much more evident.
Elder goes on to note an issue I've been writing about for really a long time:
Related, is it a worry that just three mining pools accounted for more than 45 per cent of this week’s block production? Given nearly all the hardware used across the network is Chinese-made, with Beijing-based Bitmain Technologies alone having an estimated market share of 82 per cent, when do concentration levels among a few organisations become a security concern?
Yes, this concentration has been a problem for Bitcoin's entire history, but everyone has decided to ignore it. As I write, on 6th January 2026, over the last three days Foundry USA and AntPool have controlled 51.2% of the hash power. As I explained at length in Sabotaging Bitcoin, there are practical difficulties facing an insider attack with 30% of the hash power, but with 51.2% things are much easier.
Bitcoin mining is quietly staging a comeback in China despite being banned four years ago, as individual and corporate miners exploit cheap electricity and a data center boom in some energy-rich provinces, according to miners and industry data.
China had been the world's biggest crypto mining country until Beijing banned all cryptocurrency trading and mining in 2021, citing threats to the country's financial stability and energy conservation.
After having seen its global bitcoin mining market share slump to zero as a result of the ban, China crept back to third place with a 14% share at the end of October, according to Hashrate Index, which tracks bitcoin mining activities.
This may be what the 80% of new data centers in China that were empty because unsuitable for AI are being used for.
Stablecoins have long been pitched as crypto’s on-ramp. Swapping fiat money for a fiat-pegged stablecoin like Tether’s USDT or Circle’s USDC allows a trader to switch in and out of positions without having to touch tradfi.
Shouldn’t an on-ramp also work as an off-ramp? There’s not much evidence it does. In the six weeks or so when $1.2tn in value was drawn down from the cryptoverse, the market cap of USDT has increased by approximately $20bn:
This USDT graph is updated from the one Elder used. It shows a clear break in the upward trend on 24th October. In the 10 preceding weeks it increased by $17B (~10%) as Bitcoin traded beteween a low of $108K and a high on 6th October of almost $125K.
In the 10 weeks since it has increased by only $3B as Bitcoin dropped from $111K to a low of $84K on 22nd November, subsequently trading in a range from there to $94K.
Here is its updated graph. On 24th October its market cap was around $76B, it is now around $75B. So, yes, Elder was right, it has been basically flat for 10 weeks where the preceding 10 weeks it had increased by $8B (~12%).
Had the trend of the previous 10 weeks continued, the market cap of (USDT+USDC) would have been $25B higher than it is. One way of looking at this would be that traders "withdrew" $25B or around 10% of the (USDT+USDC) market cap on 24th October. On this basis Elder is just wrong, the off-ramp has been quite busy.
Even if we assume a large percentage of stablecoins are used for non-crypto things (sports betting, remittances, crimes), the recent issuance still looks at odds with the trend.
First, this contradicts the premise of Elder's question as I understand it. Second, most of the uses Elder cites involve a chain of transactions from fiat to stablecoin to fiat on one or more exchanges. These would not cause a net increase in demand for the stablecoin, which would come from and go back to the exchange's reserves.
Maybe demand is high because crypto traders have been parking money rather than seeking to withdraw it?
First, demand isn't high relative to the historic trend, it is now $25B lower. Second, even if we accept Elder's $20B number, this is peanuts relative to the $1.2T drop in aggregate cryptocurrency market cap.
More idle money in the system ought to be good news for the likes of Coinbase, which uses the promise of higher yields on USDC deposits to sell monthly subscription schemes. And how have Coinbase shares been doing?
The day Bitcoin hit the skids on 8th, COIN closed at $387.27. By 11/20 it was down 38% while Bitcoin was down 47%. It can hardly be a surprise that COIN is highly correlated with Bitcoin.
What explains trash crash PTSD?
Next, Elder asks why cryptocurrencies haven't resumed their progress moonwards:
A popular argument among crypto commentators is that token prices are down because traders are still digesting one bad day in early October.
Reasons for the October drawdown go from banal (maybe the high-beta cryptosphere just amplified an equities pullback on US-China trade tensions?) to wonky (maybe it all cascaded from a weird synthetic stablecoin depegging on one marketplace?) to the darkly cynical (maybe the big sharp drop was to let bucket-shop crypto brokers close out customer positions they’d never actually bought?).
In anything to do with cryptocurrency, and definitely in this case, I'd go with "darkly cynical". He then asks:
If a market’s not deep, efficient or clean enough to digest a bit of one-day volatility, why get involved?
I'd agree with Elder on this. If we look at the log plot of Bitcoin's history, we can barely see the 47% drop in 6 weeks last October. We can just see, to take some recent examples, the 48% drop in 5 weeks in early 2020, and the 42% drop in 2 weeks in mid-2021. Traders who don't learn from history are doomed to repeat it. Of course, the volatility is precisely the thing that brings the traders to Bitcoin.
Crypto exchange-traded products have been haemorrhaging money all week. Spot ETP net redemptions yesterday were $1.14bn, including $901mn just from bitcoin ETPs, according to JPMorgan estimates. That’s the worst single day for net outflows since February.
With so much selling, you might expect to see an increase in bitcoin velocity, which measures the rate at which tokens move on the chain.
This graph covers a longer history than Elder's. Already back in 2021 Igor Makarov & Antoinette Schoar found that the "rate at which tokens move on the chain" was irrelevant:
90% of transaction volume on the Bitcoin blockchain is not tied to economically meaningful activities but is the byproduct of the Bitcoin protocol design as well as the preference of many participants for anonymity ... exchanges play a central role in the Bitcoin system. They explain 75% of real Bitcoin volume.
Velocity dropped sharply until November 2023, and then continued to drop gradually. November 2023 was the start of a major increase in Bitcoin's price, which coincided with a sustained increase in trading volume on exchanges.
It thus seems likely that the trend identified by Makarov & Schoar that on-chain activity was largely confided to exchanges increased between 2021 and 2023, and was then saturated. Elder's explanation is only part of the story:
Bitcoin velocity has been plummeting for years, for reasonable reasons. “Digital gold” overtook “internet money” as the preferred reason to hold, while derivatives like perpetual futures removed any need to faff around with the underlying asset.
It isn't just derivatives. Spot trading happens on exchanges. The blockchain is pretty much only used for inter-exchange netting transactions. So Elder's question misses the point:
Nevertheless, is it odd to have a sudden wave of selling that’s almost invisible
in the underlying asset? Bitcoin velocity has barely changed over the past
month, having bounced meekly off a record low in early October. Why?
Having a vast derivative market based off a much smaller spot market on exchanges based on a tiny set of transactions on the blockchain is a wonderful playground for traders, because it is easy to manipulate.
Spoiler: No. In this section Elder expresses skepticism about a piece by Alex “Crypto Alex” Saunders, of Citigroup suggesting that:
The halving cycle is a reason that long-time Bitcoin holders are nervous. We show the price performance in the years after halvings in Figure 3 with the second year showing weakness. These crypto winters have been associated with 80%+drawdowns in the past as shown in Figure 4.
Elder doesn't need any help from me on this "chart necromancy". Halvenings primarily affect miners by roughly halving their income without a corresponding decrease in costs. This may force them to sell coins they have stashed, which at the margin may drive the price down. But with miners' income currently around $40M/day and recent volume peaks on major exchanges around $1.4B/day this is likely to have marginal impact.
This post was written by Emily Woehrle, who attended the 2025 DLF Forum as an Emerging Professionals Fellow. The views and opinions expressed in this blog post are solely those of the author and do not necessarily reflect the official policy or position of the Digital Library Federation or CLIR. 2025 Emerging Professionals Fellowships were supported by a grant from MetaArchive.
Emily Woehrle is a Digital Content Librarian at the University of Toronto Libraries, where she supports a large-scale website renewal project and manages the library’s LibGuides service. She also works as a part-time librarian at the Toronto Public Library. With a background in non-profit communications and content management, Emily brings an interdisciplinary perspective to her work and looks forward to sharing experiences and learning from peers at the DLF Forum to advance sustainable, user-centered digital library practices.
Documentation as responsible digital stewardship
Attending the DLF Forum as one of the Emerging Professionals fellows was an incredibly positive experience that left me with new connections, new ideas, and a validating sense of solidarity. The Forum was only my second library conference, yet I felt immediately comfortable among people who get it and were ready to share and listen to each other’s experiences. It was also a joy to navigate the conference with my fellow Fellows.
Two presentations stood out to me over the course of the Forum, and neither focused on trendy hot topics. Instead, they highlighted the importance of documentation; the practical, behind-the-scenes work that keeps digital libraries and archives running by codifying tacit knowledge and establishing the workflows, structures, and guidelines that sustain digital library work.
In my current role, I’m coordinating a large-scale website consolidation project that requires my colleagues and me to build processes and governance structures impacting 20+libraries and departments. Documentation has become essential to scaling the project and keeping everyone aligned. Over the past year, I’ve spent a lot of time thinking about the most effective ways to develop knowledge-management systems, why some workplace cultures prioritize them more than others, and what that means for long-term success.
The first session, “Agile Documentation Development for Digital Preservation Systems,” offered strategies to make documentation immediately useful, iterative, and collaborative. The presenters emphasized creating “minimum viable documents” that favor progress over perfection – start with something usable, then refine it over time. They also underscored how role clarity and interdepartmental culture shape the success of documentation efforts. This session helped me reframe documentation as a living tool whose maintenance must be built into our work rather than treated as an afterthought.
The second session, “Renaming Failure as “readme.files”: Lessons Learned from Early and Mid-career Archives Perspectives,” reminded me that unexpected challenges are inevitable and that they can serve as learning opportunities instead of being perceived as failures. The speaker spoke about the importance of recording “detours” as they happen and how documentation can play a key part in reflection on lessons learned. She also discussed the value of using documentation to close “open loops” when offboarding from a project, ensuring that future staff can build on past work rather than unknowingly duplicating it. It was a practical reminder that documenting failure isn’t about dwelling on mistakes; it’s about giving the next person a clearer path forward.
Taken together, these sessions reinforced that documentation is more than a checklist. It can be a form of care—not only for colleagues and users who will later take on or inherit the work, but also for the library systems that depend on it. Creating collaborative documentation is an often overlooked and undervalued core competency, yet it is fundamental to both project and organizational success. I left the Forum with a renewed commitment to integrating these approaches into my own knowledge-management practices and to advocating for clearer, more collaborative documentation across the teams I work with.
In the fall of 2025, I was presented with the exciting opportunity to teach CS 433/533: Web Security at Old Dominion University (ODU). This course was designed and previously taught by Dr. Michael L. Nelson. Having experienced this class firsthand as a student, I was thrilled to transition into the role of an instructor, bringing my unique perspective to the curriculum. Through this blog, I aim to share my journey and insights from teaching this course, with the hope that my experiences will serve as a useful resource for fellow colleagues and those venturing into teaching for the first time.
The goal of this course was to review common web security vulnerabilities and exploits, along with the defenses designed to counter them. Students explored topics such as browser security models, web application vulnerabilities, and various attack and defense mechanisms including injection, denial-of-service, cross-site scripting, and more. Alongside theoretical knowledge, students also gain hands-on experience with technologies like Git and GitHub, DOM and JavaScript, the command line interface (CLI), and Node.js.
Before the class commenced, one of the primary tasks involved setting up the course online where students could easily access materials and engage in communication. This platform is crucial, as it serves as the central point for sharing the syllabus, detailing office hours, distributing course materials, and facilitating ongoing dialogue with students. This course utilized GitHub primarily for assignments and sharing resources. While Google Groups were previously utilized effectively for communication, I transitioned to Canvas, the official learning management system of ODU. This decision leveraged a familiar environment, minimizing the learning curve for students and streamlining course interactions.
The first task on Canvas was crafting an updated syllabus that clearly conveyed the course's essence and objectives. It also laid out prerequisites, grading criteria, and ODU's plagiarism policies. It provided students with a clear roadmap of what to expect, including schedules and exam details. Additionally, I strongly recommend implementing a weekly Summary Schedule, an approach inspired by Dr. Michele Weigle's courses. This schedule detailed the topics to be discussed each week, listed any assignments for that week, and their respective due dates. This approach not only helped students gain a clear overview of the entire course, but it also helped me keep track of everything and stay on schedule. It also facilitated timely communication, as it reminded me when to send out weekly announcements, release assigned tasks, and mark due dates to ensure efficient grading.
One of the highlights of this class was the weekly discussion forum, which significantly enhanced communication among students. Initially, Dr. Nelson had developed an activity where students would retweet tweets related to web security weekly on Twitter/X, followed by in-class discussions. This approach was an excellent way for students to learn about current trends and major news in web security. However, as the class was asynchronous, I needed a different method to maintain this engagement. I utilized Canvas to create weekly discussion forums where students could earn points by sharing the latest stories or news related to web security. Each week, I observed students sharing intriguing news and actively reacting to and discussing each other's posts. This method was not only enjoyable, but it also fostered a collaborative learning environment, allowing us all to discover new information together each week.
Canvas Discussion Forum for students to post weekly updates on web security news
Next, it's essential to establish a communication channel with students. I used Canvas Announcements to send weekly messages that informed students about the week's focus, the materials they would need, links to lectures and slides, and any updates regarding assignments. If you have prepared materials in advance, Canvas allows you to schedule these announcements to be released at a later date. This approach ensures timely and organized communication, keeping students informed and engaged throughout the course.
As the saying goes, "All fingers are not equal," and this holds true for students as well. Each student learns at their own pace, some grasp concepts quickly, while others need a bit more time. I learned that it's crucial to offer flexibility and understanding to accommodate these differences. When I first noticed that some students were scarcely participating in class, I realized I needed to take proactive steps. Reaching out to struggling students via email, acknowledging their challenges, and inviting them to connect if they needed support proved to be an effective strategy. This simple gesture often served as an icebreaker, leading to increased attendance at office hours and more frequent email communication. I also discovered that many students in my class preferred office hours after standard working hours due to their job commitments. In response, I adjusted my regular office hours to accommodate students' working schedules, moving them to after 5 PM. Timely grading and constructive feedback also proved to be a key to encouraging student development. Prompt feedback allowed students to reflect and improve their work over the semester. Additionally, offering extra credit opportunities, provided students the chance to boost their grades and reinforce their understanding.
Reflecting on my experience teaching this course, I've come to appreciate the dynamic nature of education and the profound impact that thoughtful instructional design can have on students' learning experiences. Transitioning from student to instructor offered me a unique perspective, allowing me to tailor the course to address the diverse needs and learning styles of my students. Developing online resources, a detailed syllabus, and an interactive discussion forum highlighted the importance of clear communication. Building a supportive environment requires flexibility and empathy, acknowledging each student's unique challenges. Adjusting office hours and maintaining open communication ensured students felt supported, while consistent feedback and extra credit fostered growth and improvement. Overall, I had immense fun connecting with the students, understanding their perspectives, and learning alongside them. The collaborative learning atmosphere enriched not just their educational journey but also my teaching experience, reminding me how rewarding it can be to explore new ideas together.
I extend my heartfelt gratitude to Dr. Michael L. Nelson, Dr. Michele C. Weigle, and Dr. Steven J. Zeil for providing me with this invaluable experience. This course greatly benefited from Dr. Nelson's materials. I also appreciate Dr. Nelson and Dr. Weigle for their willingness to address any questions I had.
This post was written by Dorian McIntush, who attended the 2025 DLF Forum as an Emerging Professionals Fellow. The views and opinions expressed in this blog post are solely those of the author and do not necessarily reflect the official policy or position of the Digital Library Federation or CLIR. 2025 Emerging Professionals Fellowships were supported by a grant from MetaArchive.
Dorian McIntush is the Open Scholarship and Data Resident Librarian at Washington and Lee University, where he supports faculty and students with digital research and open knowledge initiatives. He has a commitment to creating equitable access to knowledge and is particularly interested in exploring the environmental impact of digital technologies and open scholarship models that prioritize accessibility and long-term sustainability. Beyond his professional work, he enjoys tromping through Virginia’s hiking trails with his dog, taking on new knitting projects, and cooking interesting recipes for dinner.
When I stepped into my current role of Data and Open Scholarship Resident Librarian at Washington and Lee University in July of this year, I was also stepping for the first time into the world of academic libraries. I focused on public libraries during my MLIS and after graduation I worked at the DC Public Library. My new academic librarian position was also brand new at my institution and was constructed to be a librarian residency. This meant that I would have a lot of freedom to grow into and shape the role, but also no real history to use as a support and learn from. This was simultaneously a gift and also a little daunting.
Coming from public libraries, I had grown used to thinking about access in very practical, immediate terms. Who has a library card? Who can physically get to our building? What barriers keep people from the resources they need? But the sessions at DLF pushed me to think about access in ways that felt more expansive.
Amber Dierking’s presentation on the Queer Liberation Library was a particular highlight for me. I’d already been a user and huge fan of QLL, but hearing Dierking talk about the work behind it reinforced everything I loved about their approach. QLL didn’t reinvent the wheel. They focused on using existing tools, keeping it simple, making it free. As someone building a role from scratch, the creative pragmatism of QLL felt like a blueprint I could make use of.
I was also drawn to Mariam Ismail’s presentation on the 23/54 Project. The work of preserving a community quilt through 3D scanning and building an interactive digital exhibit felt like a perfect example of what digital humanities could be at its best: deeply rooted in community, respectful of material culture, and genuinely expanding access rather than just digitizing for digitization’s sake. It made me think about the special collections and archives at my own institution and how we might engage descendant communities and students in similar ways.
The Data Advocacy for All Toolkit presentation tied these threads together for me in a way I didn’t expect. The team was talking about who gets to tell stories with data, who gets left out of those stories, and how we can teach people to use data ethically for social change. This toolkit offered a framework that felt aligned with my public library values, one that’s accessible, focused on equity, and designed to empower data users and learners.
DLF gave me permission to think big while starting small. I’m returning to W&L with a clearer sense of what this residency could become, not a replica of someone else’s role, but something shaped by the communities I serve and the values I bring from public libraries into this new academic space.
Hopefully this isn’t perceived as me caving, but I’m trying to redirect
my ire at the spread
of genAI into learning how to evaluate genAI, especially when
comparing it to existing non-genAI systems, but also between different
genAI solutions (models, etc).
I don’t consider myself a doomer
or a boomer, and see genAI as normal
technology that needs to be evaluated as a technology. I know this
is a broad area, that overlaps somewhat with how the models are
themselves built (benchmarking), but if you have recommendations please
let me know?
This text, part of the #ODDStories series, tells a story of Open Data Day‘s grassroots impact directly from the community’s voices. The event ‘Leveraging Open Data for Child Advocacy in a Polycrisis Context’ was successfully held on 6th March 2025 in Imo State, bringing together child rights, teachers, advocates, policymakers, data analysts, church leaders and...
This text, part of the #ODDStories series, tells a story of Open Data Day‘s grassroots impact directly from the community’s voices. On March 4, 2025, the YouthMappers Chapter at the Institute of Remote Sensing and GIS (IRS), Jahangirnagar University, proudly celebrated Open Data Day 2025 with an impactful event titled “Mapping Resilience: Harnessing Open Data...
I learned about Marimo a few months ago
from this
podcast episode and have been meaning to try it out. As a long time
user of Jupyter notebooks I was
interested to hear how Marimo was built (in part) to help solve the
problem of reproducibility
in data science and research software (Pimentel, Murta, Braganholo, & Freire,
2019). This is a problem I have had a lot of experience with,
especially when sharing Jupyter notebooks with others.
The key thing that Marimo brings to the Python notebook to improve
reproducibility is reactive execution. Marimo uses the Python
AST to
remember what cells depend on other cells, and when a change in one
requires the execution of another, it will go and update it for you.
Because of how they are created and edited, it’s very common for Jupyter
notebooks to get into an inconsistent state because of the order in
which cells are executed. This problem goes away with Marimo.
But, this aside, I thought I’d mention some somewhat superficial things
that I immediately liked about Marimo…bearing in mind I’ve only been
using it for one day.
Pandas dataframes appear as nicely formatted tables that can be easily
scrolled horizontally, without truncation of values, or elided columns.
I’ve gotten this to work in Jupyter notebooks in the past, but it always
requires some fiddling it seems, and Marimo does it out of the box.
Table columns are sortable, filterable and can be summarized.
You can page through large tables.
You can easily download tables
You can commit your notebook to a git repository, and diffs in pull
requests make sense.
You can easily run the notebook from the command line.
You can embed tests in your notebooks, and run them separately.
Built in basic charts (pie, bar, line, etc) which you can view source
for and hand craft if you want (seems to use Altair).
The Department of Computer Science (CS) at Old Dominion University (ODU) hosted its annual Trick-or-Research event on October 31, 2025, blending academic exploration with Halloween-inspired creativity. Check out our previous Trick-or-Research blog posts for 2021, 2022, 2023, and 2024. Building on the success of previous years, this event brought together faculty, staff, and students to showcase the department’s cutting-edge research and encourage new collaborations. Designed especially to introduce undergraduate students to the wide range of research opportunities within the department, Trick-or-Research featured interactive lab tours, engaging demonstrations, and opportunities to network with professors and join research groups.
🎃 Trick or Research! | ODU CS Lab Tours 2025 👩💻👻 Tour CS labs, meet faculty & grad students, and win prizes!— Computer Science Graduate Society - ODU (@CSGS_ODU) October 13, 2025
Participants explored CS research labs in person at The E.V. Williams Engineering & Computational Sciences Building (ECSB) and Dragas Hall, with virtual option via Gather.town for remote attendees. To add to the festive atmosphere, attendees were encouraged to show their Halloween spirit by dressing in costume, with opportunities to win CS swag and a special prize for the best costume. The combination of hands-on research experiences, creative expression, and community engagement made Trick-or-Research an event that was both academically enriching and fun. 🎃
The Web Science and Digital Libraries (WS-DL) group, led by Dr. Michael Nelson and Dr. Michele Weigle, welcomed visitors interested in web-focused research and digital preservation. Lab members discussed ongoing projects through posters and informal conversations, answering questions about research directions and opportunities for student involvement. The group’s research spans web archiving, web science, social media analysis, digital preservation, human-computer interaction, accessibility, information visualization, natural language processing, machine learning, artificial intelligence, and scholarly data mining. Visitors also had the opportunity to learn more about CS graduate courses and pathways into research.
Lab for Applied Machine Learning and Natural Language Processing Systems (LAMP-SYS)
The LAMP-SYS lab, led by Dr. Jian Wu, shared its work in applied machine learning and natural language processing. Visitors learned about ongoing research in areas such as entity extraction, mining electronic documents, and computational reproducibility in deep learning. Lab members discussed how machine learning and NLP techniques are applied to real-world problems using building blocks from information retrieval, digital libraries, and scholarly big data.
Neuro Information Retrieval and Data Science (NIRDS) Lab
The Neuro Information Retrieval and Data Science (NIRDS) lab, led by Dr. Sampath Jayarathna, engaged attendees with demonstrations and discussions centered on perception- and cognition-aware systems. Students shared examples of their research involving eye tracking, EEG, wearable sensors, and explained how these technologies are used to study user behavior and support real-world applications. The lab’s work emphasizes integrating psychophysiological signals with information retrieval and data science.
Accessible Computing Group
The Accessible Computing group, led by Dr. Vikas Ashok, introduced visitors to research focused on improving digital experiences for users with visual impairments. Lab members discussed intelligent interactive systems, accessible user interfaces, and image-to-speech technologies. Through demonstrations and conversations, the team highlighted how their work enhances web accessibility and human-computer interaction.
Bioinformatics Lab
The Bioinformatics Lab, led by Dr. Jing He, showcased research in computational biology and bioinformatics. Posters and discussions highlighted projects involving genomic data analysis, protein structure modeling, and 3D molecular imaging. Lab members also explained how machine learning techniques are applied to address challenges in medicine and health-related research.
High Performance Scientific Computing Team for Efficient Research Simulations (HiPSTERS)
The HiPSTERS group, led by Dr. Desh Ranjan and Dr. Mohammad Zubair, introduced students to interdisciplinary research in high-performance computing (HPC). Visitors learned about the group’s use of advanced mathematical methods and GPU programming to support large-scale simulations, including examples related to particle collider beam dynamics and scientific computing workflows.
Artificial Intelligence (AI) and Applications Research Group
The AI and Applications research group, led by Dr. Yaohang Li, shared ongoing work in artificial intelligence and machine learning. Through posters and discussions, visitors learned about projects involving machine learning-based physics event generation, particle production simulations, protein crystallization classification, financial data analysis, and generative models. The group connected with students interested in applying AI techniques across scientific and real-world domains.
Hands-On Lab
The Hands-On Lab, established by Ajay Gupta, presented research focused on building practical, end-to-end systems. Lab members discussed projects involving real-time monitoring using sensors and wearables, health-related data collection and analysis platforms, learning management portals, and mobile applications for medical and educational use. Visitors learned how these systems are designed, implemented, and evaluated in real-world settings.
Data Mining Lab
The Data Mining Lab, led by Dr. Lusi Li, shared research in data mining, machine learning, and optimization theory. Topics discussed included online machine learning, representation learning, transfer and multi-view learning, recommender systems, and explainable AI. Attendees explored how these techniques are applied to complex datasets across different application areas.
Internet Security Research Lab
The Internet Security Research Lab, led by Dr. Shuai Hao, presented research focused on networking and security. Lab members discussed measurement-driven and data-centric approaches to studying internet infrastructure, web security, privacy, and cybercrime. Visitors learned how empirical analysis and large-scale data studies are used to understand and address modern security challenges.
Wadduwage Lab
The Wadduwage Lab, led by Dr. Dushan N. Wadduwage, focuses on developing novel computational microscopy techniques that capture biological systems at their most information-rich representations while minimizing redundancy. Students learned how the lab integrates optics, machine learning, and signal processing to advance high-fidelity biomedical imaging and build trustworthy medical AI systems. Lab members discussed research in computational and differentiable microscopy, interpretable and reliable AI for medical decision-making, and advanced tracking algorithms that enable pinpoint-level object and particle tracking in microscopic environments. Through these conversations, visitors gained insight into how interdisciplinary methods are applied to solve real-world challenges in biomedical imaging.
Summary
The 2025 Trick-or-Research event once again highlighted the depth and diversity of research within ODU’s Computer Science department. By combining hands-on demonstrations, engaging conversations, and a festive hybrid format, the event provided students with valuable insight into research opportunities and pathways for involvement. Whether attending in person or virtually, participants left with a deeper understanding of the innovative work happening across CS. If you missed this year’s event, be sure to keep an eye out for the next Trick-or-Research! 🎃💻
This post was written by Darcy Ruppert, who attended the 2025 DLF Forum as a Public Library Worker Fellow. The views and opinions expressed in this blog post are solely those of the author and do not necessarily reflect the official policy or position of the Digital Library Federation or CLIR. The 2025 Public Library Worker Fellowship was supported by Platinum sponsor AM Quartex.
Darcy Ruppert is an archivist and librarian living and working in the greater Seattle area. Since receiving their MLIS from the University of Washington in 2023, Darcy has worked in various museums, special collections, and community archives, specializing in the digital preservation of audiovisual collections. Their professional work has been defined by a commitment towards democratizing access to digital archives themselves and the tools of digital preservation. They are currently managing King County Library System’s Memory Lab, a Mellon Foundation-funded community oral history project with a mission to record, preserve, and share the stories of King County.
I am so grateful to have had the opportunity to attend my first DLF Forum as a 2025 Public Library Worker Fellow. In my current work as project manager for a new community oral history project based out of a large public library system, I often feel somewhat separate from the day-to-day of the rest of my organization. The work that I do connects to and is born out of the work of the library, but the unique nature of the program within my organization means that I am often working through problems and making decisions on my own. For this and many other reasons, it was refreshing to be surrounded by a community of my professional peers who are facing similar challenges and grappling with similar emergent questions, both practical and philosophical, within our field.
The first day’s opening plenary by Dr. Kay Coghill provided, for me, a grounding moment at the very beginning of the Forum. Dr. Coghill shared an entreaty for all of us, as digital library professionals and as human beings, to use our platforms, skills, and resources to mitigate harms to members of systemically marginalized groups in digital spaces. Their incisive talk made me think about my own positionality in digital spaces, and drove me to reflect on my own professional decisions and the cascading effects these (at times, seemingly small) decisions can have. In the work that we do, I think it’s easy to become complacent, to lose sight of the fact that we hold power to protect and, by the same token, harm, when we introduce new solutions without appropriate testing, community consultation, and evaluation. I think there’s a real danger in our field of focusing so much on integrating new technologies and providing “results” to our institutions that we may passively introduce real risks into the lives of our users and members of our greater community.
With Dr. Coghill’s talk framing the rest of the Forum for me, I think I appreciated the sessions I attended with a rejuvenated perspective towards care and stewardship. I thought about the race to adopt “industry standard” digital preservation tools, and what we lose when we fail to properly evaluate these tools for the unique needs of our organizations and user groups. At the University of Denver’s session on curating digital exhibits, I reflected on our ability as cultural heritage stewards to uplift and uncover marginalized voices rather than bend to dominate cultural narratives. At a session on AI-powered transcription, I considered the balance of risk and reward that is inherent to the world of LLMs. I’m thankful for all of the speakers who generously shared their work at the Forum, and for the opportunity to reflect on these important issues alongside my peers.
LibraryThing is pleased to sit down this month with Kelly Scarborough, who makes her authorial debut this month with Butterfly Games, a historical novel set in the Swedish royal court during the early 19th century. After working for two decades as a law firm partner and white-collar prosecutor, Scarborough returned to her interest in historical fiction and her love of writing, determined to tell stories about fascinating women who lived through challenging times. Scarborough sat down with Abigail this month to discuss her new book, due out later this month from She Writes Press.
Butterfly Games is based on a true story, and its heroine, Jacquette Gyldenstolpe, on a real person. Tell us a little bit about that story and how you discovered it. What made you feel that it needed to be retold?
Like so many turning points in my life, Butterfly Games began with a book. As a teenager, I fell in love with Désirée, Annemarie Selinko’s novel about Désirée Clary—the silk merchant’s daughter who was once engaged to Napoleon and later became Queen of Sweden. I read it over and over, fascinated by how a woman could be swept into history by forces she never chose.
Years later, during a difficult period in my life, that novel came back to me. I began researching Désirée’s descendants—the Bernadotte dynasty, which still reigns in Sweden today—and uncovered a world of political upheaval, fragile alliances, and private heartbreak. That’s when I stumbled across Jacquette Gyldenstolpe.
Jacquette appears in the historical record mostly as a scandal: a young countess who fell in love with Prince Oscar, the heir to the throne. But the more I read—letters, memoirs, court gossip—the more I realized how much of her story had been left untold. She wasn’t just a footnote in someone else’s rise to power. She was a young woman navigating impossible choices in a world where love could threaten a dynasty.
Once I found her, I couldn’t look away. I knew her story needed to be retold.
What kind of research did you need to do, while writing the book, and what were some of the most interesting things you learned in that process?
Can you see me smiling? I don’t think I’m capable of separating the research I needed to do from the research that simply called to me and took over my brain.
Over the course of several years, I spent more than eighty nights in Sweden, translated hundreds of handwritten letters, and built a chronology with more than five thousand entries to track who was where, with whom, and why. Jacquette’s world became a place I loved to inhabit. One day stands out above all others. I was granted special access to Finspång Castle, Jacquette’s childhood home—now a corporate headquarters, a place closed to the public. No photographs were allowed, so I took frantic notes on my phone as we walked through the women’s wing. In a sitting room, I noticed a small mother-of-pearl nécessaire—a sewing and writing box with tiny compartments for her most personal objects. It stopped me cold. My guide, a retired corporate executive who knew the house intimately, leaned in and whispered, “Jacquette’s.”
The box had been a gift from Jacquette’s husband, Carl Löwenhielm. That moment—imagining her hands opening it, choosing a needle or a quill knife—changed the direction of the book.
Suddenly, Jacquette wasn’t a scandal or a symbol. She was real.
Your book has been described as a good fit for admirers of Philippa Gregory and Allison Pataki. Did the work of these authors, or others, influence you when writing your story?
Absolutely—though in different ways. Philippa Gregory is a master of taking a story with a known, often tragic ending and making it feel suspenseful and intimate. I admire how she builds emotional momentum even when readers think they know what’s coming. Two of my favorites are The Kingmaker’s Daughter and her most recent novel, Boleyn Traitor.
Allison Pataki has also been influential, particularly in how she blends rigorous research with accessible storytelling. I love the smart, resourceful heroines she creates from women who otherwise might be lost to history. Her work reminds me that historical fiction can be immersive without being intimidating—and romantic without losing its seriousness. Both my book clubs loved Finding Margaret Fuller, and I did, too.
You’ve had a full career as a lawyer and prosecutor, before turning to writing. How has that work informed your writing and storytelling?
Don’t get me wrong, I had a lot to learn before writing a novel, but some of the things I loved about law proved useful for writing historical fiction. Law trained me to think in terms of evidence, motive, and connections. When you’re preparing a case, you assemble fragments—documents, testimony, inconsistencies—and shape them into a coherent narrative that persuades a jury.
Writing historical fiction isn’t so different. The facts matter deeply, but facts alone don’t tell a story. You have to decide what belongs at the center, what remains in the background, and where the emotional truth lives. My legal background also made me comfortable sitting with ambiguity. History is full of unanswered questions, and I don’t feel the need to resolve every one neatly. Sometimes what’s most compelling is what can’t be proven.
Tell us a little bit about your writing process. Do you have a particular routine—a time and place you like to write, a particular method? Do you plot your stories out ahead of time, or discover how they will unfold as you go along?
When the stars align, I retreat early in the day to the attic office of my nineteenth-century house in Connecticut, take my Shih Tzu upstairs with me, and leave the modern world behind. I wrote Butterfly Games in nine drafts. There was an outline, but I changed the plot in significant ways as I went along. For the sequel, I’m trying to be a little more disciplined. I started with an outline—but found myself getting too granular—so I switched to ninety old-fashioned index cards. Each card holds one scene: chapter number, date, setting, point-of-view character, and the scene’s pivot point. There’s barely room left for anything else, which forces clarity. I transcribed those cards into Scrivener, and now I’m writing. We’ll see how closely I stick to the plan.
What comes next? Are you working on any additional books?
Yes. Butterfly Games is the first novel in a planned series. The second book picks up after the events of the first and follows Jacquette and Oscar into a far more dangerous phase of their lives—when love has consequences, secrets carry weight, and survival requires choices that can’t be undone.
Tell us about your library. What’s on your own shelves?
My physical library is filled mostly with historical fiction, especially novels with complex, non- linear structures. I return again and again to Hamnet and The Marriage Portrait, as well as The Time Traveler’s Wife and Pure.
On a special shelf, I keep books connected to Jacquette’s world—like Désirée and The Queen’s Fortune—alongside more than a hundred antique Swedish memoirs and histories, many written by people who actually knew Jacquette.
What have you been reading lately, and what would you recommend to other readers?
For lovers of royal historical fiction, Boleyn Traitor is a must-read. I was also lucky enough to read an advance copy of It Girl, which I loved.
My favorite read last year was Broken Country—a deeply emotional novel with one of those intricate narrative structures that stays with you. In fact, I want to read it again.
A general strike is when working people refuse their labor until demands
are met • Research shows We need 3.5% of the population, OR 11 million
Americans, to be successFul • The STRIKE CARD below tracks our progress
so we all know When it’s time to strike •
Your Second Brain has little somatic metadata. It’s disembodied text
floating in a void, stripped of the rich contextual markers that would
actually help you remember and use it. When you try to retrieve
something from your Obsidian vault, you’re searching keywords. When you
try to retrieve something from your actual brain, you might think “that
thing I was reading when I was annoyed at that airport” and the whole
cluster of associated memories lights up.
We’ve been treating digital notes like they’re interchangeable with
mental notes, when they’re actually a much degraded format.
Here are the beginnings of a pattern language for user interface design.
These patterns drive the initial phases of design. They key off of
Story, a pattern from the early development language. The patterns are:
User Decision
Task
Task Window
I’m indebted to the user interface pattern mailing list and to Ward
Cunningham for the seeds for these patterns.
Earlier this year, we warned you to turn off Gemini on Android because
Google decided that its AI would have access to its users’ apps - even
if they had previously turned tracking for Gemini Apps Activity off. So
regardless of whether you told Google’s Gemini not to track you in the
past, its AI tool might be able to run tasks like send WhatsApp
messages, set timers, and even make calls on your Android device.
Worryingly, Google’s AI invasion does not stop there. Now, Google has
turned on settings like smart features, without your consent, and Gemini
can scan your Gmail emails, Photos, Drive, and other apps. In this
guide, we show you how to turn off Gemini on Android and all your Google
apps – Gmail, Chrome, Photos, and more. Protect your privacy and your
data from invasive AI tracking
/e/OS is an open-source mobile operating system paired with carefully
selected applications. They form a privacy-enabled internal system for
your smartphone. And it’s not just claims: open-source means auditable
privacy. /e/OS has received academic recognition from researchers at the
University of Edinburgh and Trinity College of Dublin.
The Information Technologies (IT) industry has an increasing carbon
footprint (2.1-3.9% of global greenhouse gas emissions in 2020),
incompatible with the rapid decarbonization needed to mitigate climate
change. Data centers hold a significant share due to their electricity
consumption amounting to 1% of the global electricity consumption in
2018. To reduce this footprint, research has mainly focused on energy
efficiency measures and use of renewable energy. While these works are
needed, they also convey the risk of rebound effects, i.e., a growth in
demand as a result of the efficiency gains. For this reason, it appears
essential to accompany them with sufficiency measures, i.e., a conscious
use of these technologies with the aim to decrease the total energy and
resource consumption. In this thesis, we introduce a model for data
centers and their users. In the first part, we focus on direct users,
interacting with the infrastructure by submitting jobs. We define five
sufficiency behaviors they can adopt to reduce their stress on the
infrastructure, namely Delay, Reconfig, Space Degrad, Time Degrad and
Renounce. We characterize these behaviors through simulation on
real-world inputs. The results allow us to classify them according to
their energy saving potential, impact on scheduling metrics and effort
required from users.
Hello! This past fall, I decided to take some time to work on Git’s
documentation. I’ve been thinking about working on open source docs for
a long time – usually if I think the documentation for something could
be improved, I’ll write a blog post or a zine or something. But this
time I wondered: could I instead make a few improvements to the official
documentation?
This specification defines a Zstandard-based format for compressed WARC
files, as an alternative to the GZIP-based format defined in WARC/1.1
Annex D.
In general, Zstandard can produce significantly smaller files than GZIP
while also achieving faster compression and decompression. Zstandard
also offers a much wider range of compression levels, ranging from
extremely fast compression with a modest size reduction to extremely
slow compression with a much better reduction. For files containing many
small records, Zstandard dictionaries can be used to reduce file size
even further, while still permitting random access to individual
records.
A scathing critique of proposals to geoengineer our way out of climate
disaster, by the bestselling authors of Overshoot
The world is crossing the 1.5°C global warming limit, perhaps exceeding
2°C soon after. What is to be done when these boundaries, set by the
Paris Agreement, have been passed? In the overshoot era, schemes
proliferate for muscular adaptation or for new technologies to turn the
heat down at a later date by removing CO2 from the air or blocking
sunlight. Such technologies are by no means safe; they come with immense
risks and provide an excuse for those who would prefer to avoid limiting
emissions in the present. But do they also hold out some potential? Can
the catastrophe be reversed, masked or simply adapted to once it is a
fact? Or will any such roundabout measures simply make things worse?
The Long Heat maps the new front lines in the struggle for a liveable
planet and insists on the climate revolution long overdue. In the end,
no technology can absolve us of respon
Perennials are plants that have a life cycle of at least three years—as
opposed to annuals (plants that have to be grown from seed anew each
year because they have a single-year lifecycle) and biennials (plants
that spend a year growing and then another year producing seed and
dying—so they have a two-year life cycle). Some perennial plants are
herbaceous (meaning they have tender stalks that may die back in the
cold season, then grow again from the root) and others are woody
(meaning they have woody stalks that tend to continue growing above soil
year after year), In this zine we are mainly discussing edible
herbaceous perennials, but we will mention a few woody plants as well.
In this project, we attempt to establish a large-scale soundscape
monitoring network and characterize ecosystem-specific soundscapes by
separating sounds from geophonic, biological, and anthropogenic sources.
Based on information retrieval techniques, the acoustic data are
transformed into metrics that describe the quality of acoustic habitat,
the behavior of soniferous animals, and noise-generating activities. The
outcomes will allow managers and stakeholders to use soundscape
information to monitor the trends of marine ecosystems and perform
data-driven decision making in conservation management.
« Il neige. » Indépendamment de tout cela et de tout ce moi, la neige a
toujours été un conversationnel ; un élément de nos conversations
communes, parce que même à l’époque où elle n’était pas rare, même à
l’époque où elle était attendue, elle advenait et survenait
soudainement, nuitamment le plus souvent ou tôt le matin derrière les
vitres de nos écoles et de nos yeux encore étourdis de sommeil. Elle
arrivait et tout le paysage changeait. La neige est une mutation du
paysage et de l’accroche de presque tous nos sens. L’une des rares
mutations de la nature qu’il nous est donné d’observer en totalité.
Sorry, Baby is a 2025 American black comedy-drama film written and
directed by Eva Victor, in their directing debut. Starring Victor, Naomi
Ackie, Louis Cancelmi, Kelly McCormack, Lucas Hedges, and John Carroll
Lynch. The film follows a reclusive college literature professor
struggling with depression following a sexual assault.
The film had its world premiere at the 2025 Sundance Film Festival on
January 27, where it won the Waldo Salt Screenwriting Award and received
widespread critical acclaim. It was released by A24 in selected theaters
in the United States on June 27, before expanding nationwide on July 25.
The film grossed $3.3 million worldwide against a production budget of
nearly $1.5 million. For their acting, Victor was nominated at the 83rd
Golden Globe Awards in Best Actress in a Motion Picture – Drama. For
their filmmaking, Victor won Best Directorial Debut from the National
Board of Review and was nominated for Best Original Screenplay at the
31st Critics’ Choice Awards.
Deep Learning with Python, Third Edition makes the concepts behind deep
learning and generative AI understandable and approachable. This
complete rewrite of the bestselling original includes fresh chapters on
transformers, building your own GPT-like LLM, and generating images with
diffusion models. Each chapter introduces practical projects and code
examples that build your understanding of deep learning, layer by layer.
The third edition is available here for anyone to read online, free of
charge.
Neural nets have an inclination for recipe crafting that resembles
rewriting languages, but do not incur the cost of searching and matching
facts against a database, reagents in rules are wired directly between
each other like state-machines.
Now, that’s a ridiculous (and arrogant) statement to make, of course,
but it is an ideal that we on the htmx team are striving for.
In particular, we want to emulate these technical characteristics of
jQuery that make it such a low-cost, high-value addition to the toolkits
of web developers. Alex has discussed “Building The 100 Year Web
Service” and we want htmx to be a useful tool for exactly that use case.
Websites that are built with jQuery stay online for a very long time,
and websites built with htmx should be capable of the same (or better).
Going forward, htmx will be developed with its existing users in mind.
If you are an existing user of htmx—or are thinking about becoming
one—here’s what that means
Diderot built the Encyclopédie because he believed that organizing
knowledge properly could change how people thought. He spent two decades
on it. He went broke. He watched collaborators quit and authorities try
to destroy his work. He kept going because the infrastructure mattered,
because how we structure the presentation of ideas affects the ideas
themselves.
We’re not going to get a better internet by waiting for platforms to
become less extractive. We build it by building it. By maintaining our
own spaces, linking to each other, creating the interconnected web of
independent sites that the blogosphere once was and could be again.
This is a great question, and one I have put a lot of thought into, even
going so far as to put “Built to last forever” on the landing page.
While drafting a lengthly reply I realised that I’d never articulated
the design philosophy of Bear to anyone bar friends.
So, without further ado, here are the choices I made in designing and
building Bear with regards to longevity…
Triptych is three simple proposals that make HTML much more expressive
in how it can make and handle network requests.
If you are a practical person, you could say it brings the best of htmx
(and other attributed-based page replacement libraries, like turbo and
unpoly) to HTML. For the more theoretically-inclined, it completes
HTML’s ability to do Representational State Transfer (REST) by making it
a sufficient self-describing representation for a much wider variety of
problem spaces.
I’m building Scour, a personalized content feed that sifts through noisy
feeds like Hacker News Newest, subreddits, and blogs to find great
content for you. It works pretty well – and it’s fast. Scour is written
in Rust and if you’re building a website or service in Rust, you should
consider using this “stack”.
After evaluating various frameworks and libraries, I settled on a couple
of key ones and then discovered that someone had written it up as a
stack. Shantanu Mishra described the same set of libraries I landed on
as the “mash 🥔 stack” and gave it the tagline “as simple as potatoes”.
This stack is fast and nice to work with, so I wanted to write up my
experience building with it to help spread the word.
TL;DR: The stack is made up of Maud, Axum, SQLx, and HTMX and, if you
want, you can skip down to where I talk about synergies between these
libraries. (Also, Scour is free to use and I’d love it if you tried it
out and posted feedback on the suggestions board!)
We have developed sophisticated safety and security measures to prevent
the misuse of our AI models. While these measures are generally
effective, cybercriminals and other malicious actors continually attempt
to find ways around them. This report details a recent threat campaign
we identified and disrupted, along with the steps we’ve taken to detect
and counter this type of abuse. This represents the work of Threat
Intelligence: a dedicated team at Anthropic that investigates real world
cases of misuse and works within our Safeguards organization to improve
our defenses against such cases.
The XY problem is asking about your attempted solution rather than your
actual problem. This leads to enormous amounts of wasted time and
energy, both on the part of people asking for help, and on the part of
those providing help.
The United States has become the world’s biggest bully, threatening any
country that doesn’t do as it demands with tariffs, and its tech
companies are taking full advantage by flexing their muscle and trying
to avoid effective regulation around the world. The drawbacks of our
dependence on US tech companies have become more obvious with every
passing year, but now there can hardly be any denying that where we can
pry ourselves away from them, we should make the effort to do so.
Break up with the Big Tech cloud in this unique 1 x 6hr live training
intensive where you are wholly supported in the process of building up
your own sovereign, self-hosted and private infrastructure – free from
AI, shady data-sharing agreements and prying eyes. Running atop
renewable energy on a European Internet backbone, the cloud platform is
both tightly locked-down and easy to maintain
Once upon a time, I taught a course on AI in the Library in an iSchool. (Check out the reading list and syllabus, which are relevant context for this post.) I haven’t taught it for a while — I got busy with other things, and then ChatGPT dropped and immediately rendered my syllabus obsolete and I wasn’t up for overhauling it.
At least, that was why I wasn’t teaching it in 2022-2024. In 2025 and 2026, there are some pretty different reasons not to be adjunct faculty, particularly in a public university, if you don’t have to be. Like an enormous Project-2025-based, federally directed but decentralized system to dictate syllabi, destroy academic freedom, and fire professors who don’t toe the line. (Examples unfortunately abound, such as University of Oklahoma, Texas A&M, San José State University — the last of these being the university where I taught.)
And in the midst of all this, here’s the (excellent) Texas Tribune reporting on ChatGPT prompts used at Texas A&M to flag course content that might take a perspective on race and gender. And so, with a rising sense of nausea, I may as well see how my syllabus would fare in this brave new world.
First (and startlingly), the prompts only cover very high-level course metadata: course title, description, and learning objectives.1 The week-by-week descriptions and reading list, or indeed the syllabus as a whole, aren’t covered, so these prompts don’t reach week 2’s case study of an AI metadata generation prototype in a Black photographer’s archive, or week 3 on the broad and heavily researched field of (ironically) algorithmic bias.
And so, the results:
Course Title. Unsurprisingly, “AI in the Library” raises no issues for the state of Texas (though of course chatgpt takes a great many words to be unconcerned about it).
Course Description.
This course covers what artificial intelligence is and critical analysis of AI systems, in the context of real-world library and archival AI applications. Programming skills not required.
To my surprise, chatGPT is pretty okay with this:
Review of value-neutrality
Advocacy or ideological language: None identified. The description does not include prescriptive claims, affective outcomes, or ideological commitments.
Potential neutrality concerns: The phrase “critical analysis of AI systems” is standard academic language and does not, on its own, imply advocacy. However, “critical” can be interpreted broadly; specifying analytical methods or perspectives can improve clarity without reducing neutrality.
Overall assessment: The description is value-neutral, concise, and appropriate, though it is shorter than the requested 75–125 words and could benefit from greater methodological detail.
I was sure that “critical analysis” would get more pushback (how could we possibly want that in higher education in 2026??), but I guess mostly I’m supposed to be more unnnecessarily wordy, and I could keep waving this IYKYK flag.
Learning Outcomes.
Upon successful completion of the course, students will be able to:
Understand and explain the basics of AI: both its underlying principles and common machine learning techniques.
Discuss realistic ways that AI can be a part of library services.
Critically analyze potential pitfalls of AI systems, including the role of their underlying data sets and their ramifications in society.
Y’all. Despite some honestly fair ways chatgpt pointed out that these verbs are squishy and might be replaced with ones that are sharper and/or lend themselves more obviously to assessment, I absolutely slipped “critically analyze…their ramifications in society” right past it:
“Critically analyze potential pitfalls…” — This is largely value-neutral. The phrase “ramifications in society” is acceptable, though specifying analytical contexts (e.g., professional or institutional settings) would improve precision.
Pretty sure any antagonistic human reading learning objective number 3 there would know what I was getting at, but I guess chatgpt still can’t replace all the jobs.
There’s also a prompt for “course justificiation”, but I was not asked to write one of these for my syllabus. The closest it gets is a “core competencies” section aligning the course with learning objectives for the overall iSchool program. However, these objectives are govened by the iSchool, not the individual professors. Therefore I’ll be leaving the course justification prompt aside. ︎
“Ghost kitchens” are pop-up restaurants geared entirely toward food delivery. They typically rent space in traditional restaurants to prepare food, take orders online, and deliver them to the doorstep via delivery apps like DoorDash or Uber Eats. Ghost kitchens proliferated during the COVID pandemic, which for a time practically extinguished dine-in food service. Restaurants of all descriptions needed to restructure their operations to scale up food delivery as their main service model; ghost kitchens were the extreme example, with the entire service model built around delivery.
The story of ghost kitchens is one of a specific business sector—restaurants—retooling traditional operational structures and service models to meet changing conditions in the marketplace. Gary Pearce, Director, Academic Services in the Monash University Library, touched on a similar theme in a recent OCLC Research Library Partnership webinar, describing how the Library reimagined its operational and service models to scale up research support capacities and better address institutional needs and priorities. As with ghost kitchens, Monash sought to reimagine its services in response to changing imperatives—specifically, the need to deliver research support at scale, within the confines of prevailing budgetary limitations. This situation will surely resonate with other research libraries, and there is much to be learned from Monash’s experiences and innovative solutions.
Retooling operational structures and service models
Academic Services is one of three portfolios at Monash University Library. To address the need to scale research support services and align more closely with stakeholder needs, Academic Services shifted from a traditional liaison librarian model organized on disciplinary lines to a functional specialization approach based on library expertise. This change moved away from multiple teams providing duplicate services to specific disciplines, in favor of agile, project-based service teams that work across disciplines.
A key aspect of Monash’s approach is the creation of a new Library Business Partner role, whose chief responsibility is strategic relationship management with senior leadership in a specific academic area. The Library Business Partner serves as a conduit for two-way communication between the Library and its academic stakeholders: on the one hand, communicating library messaging to the academic unit, and on the other, gathering intelligence and feedback on the unit’s needs and mobilizing capacity within the Library’s service teams to address them.
Pearce provided a rich description of how this retooling of operational structures and service models was conceived and implemented. Here are a few of the themes that emerged from his discussion:
Acknowledging relationship management as a dedicated role: A key innovation was the creation of the Library Business Partner role to manage outreach and engagement with academic units. The Library Business Partner represents the entire Library and therefore can provide a comprehensive view of Library capacities, as well as expedite responses to stakeholder needs. Separating relationship management from service delivery facilitated a shift from a reactive, transactional model to a more proactive, two-way partnership.
Emphasizing a culture of agility: Building a service model that was both scalable and responsive led Monash to adopt an agile approach. Academic Services implemented a matrix organizational structure in which staff have fixed reporting lines with flexible membership across multiple service teams—including research support. Staff have the option to rotate across teams to deepen expertise and experience. Work is divided between “business as usual” work and project work, the latter of which can be scaled up or down as needs and resource availability dictate. While this new operational structure could pose challenges to long-standing professional identities tied to traditional service models, it also opens up new pathways to leverage existing areas of expertise and develop new ones.
Close attention to change management: The new operational structures were a significant departure from previous models. In recognition of this, the development and implementation processes were characterized by consultation, transparency, and communication, including a series of consultative visits to peer institutions facing similar challenges in adapting service development and delivery; presentations to stakeholder groups; regular updates to staff, along with clear milestones and timelines; open channels for questions and feedback; and planning for professional development needs.
These are just some of the key themes that provide the foundation for Monash Library’s story of transformation, scalability, and responsiveness.
Managing implementation is crucial
Pearce’s presentation elicited many questions from the audience in attendance. Collectively, the questions reflected a keen interest in the implementation aspect of the shift to new operational structures and service models, touching on issues like:
Stakeholder response and buy-in: how researchers and staff reacted to service model changes; channels for communication and feedback
Staffing implications: impact of restructuring on staffing counts; work allocations between “business as usual work” and project work; cross-training opportunities
Strategic relationship management: interest in the details of how the new Library Business Partner role works in practice
The audience’s interest in these topics highlight that a shift from a traditional/subject-focused service model to a functional/specialization model requires attention to both structural innovation and the staffing and stakeholder reactions to significant organizational change.
Additional reading
Pearce’s webinar intersects with several OCLC Research studies that complement some of the themes from the emerging from the service model transformation experience. First, check out our work on social interoperability, which we define as the creation and maintenance of working relationships between individuals and organizational units within an institution. Our report describes strategies and tactics that can help strengthen social interoperability skills—an essential element of roles like Monash’s Library Business Partner. In addition, OCLC Research’s forthcoming work on the Library Beyond the Library—an operational principle that emphasizes the importance of the library engaging with the broader institutional environment through strategic alignment, collaboration, and storytelling—connects with Monash’s ambitions to retool its service model to better align with institutional research needs and priorities.
Ready to dive deeper? Listen to the full recording
The webinar and subsequent Q&A offered a richly informative look behind the scenes of a major shift in operational structures and service models to better address the needs of stakeholders. If you didn’t have a chance to join us for the live webinar, please take some time to view the recording. Many thanks to Gary Pearce for sharing his perspective with all of us!
This post was written by Cláudia De Souza, who attended the 2025 DLF Forum as the Grassroots Archives and Cultural Heritage Workers Fellow. The views and opinions expressed in this blog post are solely those of the author and do not necessarily reflect the official policy or position of the Digital Library Federation or CLIR.
Cláudia De Souza is an associate professor at the College of Communication and Information at the University of Puerto Rico. She teaches in the Graduate Program in Information Science, focusing on information organization and retrieval, with particular emphasis on the analysis, evaluation, and design of digital libraries and archives. She is also the academic coordinator of the UPR Caribe Digital project, an initiative dedicated to advancing Digital Humanities research and scholarship in and for the Caribbean. She advocates for and fosters open access to knowledge, supports digital preservation, and promotes the dissemination of documentary heritage. Her work is driven by a commitment to enhancing the visibility and accessibility of information resources across the Insular Caribbean.
Attending the 2025 DLF Forum for the first time was an exceptional experience, especially as the sole fellow selected for the Grassroots Archives and Cultural Heritage Workers program. I arrived with high expectations, and the event exceeded them, offering a rich environment for learning, collaboration, and professional growth. I had the chance to meet and engage with attendees from a wide range of institutions and backgrounds, including students, emerging professionals, librarians, and archivists. I am especially grateful to the selection committee for choosing such a diverse group of fellows, which I truly appreciate. This experience of connection and dialogue with new voices gave me the opportunity to interact with a diversity of approaches in professional and academic practice, as well as the value of building collaborative networks.
One of the challenges was choosing among the multiple sessions happening simultaneously over the three days. I decided to focus on the topics most closely related to my work at the University of Puerto Rico and that I am most passionate about in library and information science: open access, metadata, information organization and retrieval, community archives, and the visibility of digital collections.
Among the new tools and approaches I explored, the Marriott Reparative Metadata Assessment Tool (MaRMAT) stood out, an open-source application designed to support reparative metadata evaluations and processes of repair and justice in information. It allows librarians to identify harmful, outdated, or otherwise problematic language in tabular metadata using pre-curated or custom lexicons. I definitely plan to explore its use in the work we are developing with community groups in Puerto Rico, as part of the UPR Caribe Digital project. I was also inspired by the presentation of Krystyna Matusiak, which demonstrated how digital collections can be expanded through exhibits that highlight the stories of underrepresented communities. Digital curation not only extends the reach of archives but also provides new opportunities to tell stories in an inclusive and meaningful way, showing how information organization can impact representation and access to collective memory. I leave the Forum inspired and motivated to apply these insights as part of the Digital Humanities initiatives we are planning at my institution, and it will serve as a model to follow.
I am grateful for the opportunity to participate and look forward to continuing these conversations and collaborations. I also hope that next year I will have the chance to submit a presentation to share with others all that I have put into practice. See you at DLF 2026!
This post was written by Amaobi Otiji, who attended the 2025 DLF Forum as a Student Fellow. The views and opinions expressed in this blog post are solely those of the author and do not necessarily reflect the official policy or position of the Digital Library Federation or CLIR. 2025 Student Fellowships were supported by a grant from MetaArchive.
Amaobi Otiji is pursuing his Master of Information at Rutgers University concentrating in the Technology, Information, and Management pathway. Prior to entering this program, Amaobi earned a bachelor’s degree in history from Howard University and has worked in roles involving federal collections, both digitized and born-digital. His professional interests center on digital curation, metadata development, and exploring new approaches to preserving and sharing underrepresented histories. He is focused on increasing equitable access to information and helping to shape how emerging technologies influence our cultural memory. In his spare time, Amaobi enjoys playing baritone ukulele, attending live theater, and playing video games.
Digital Memory Work Across Regions and Histories: Reflections on Community-Driven Projects
As I attended this year’s DLF Forum, I kept returning to two themes that resonated with me across multiple different presentations: community engagement and the quiet connective work that builds the infrastructure for it. Two of the sessions I attended during the conference stood out to me in particular because they approached these ideas from different perspectives but utilized similar underlying practices for catering their projects to their communities’ needs. These sessions were about the HBCU Digital Library Trust and the Borderlands storytelling initiative. Both of these projects work with different kinds of communities, rooted in distinct histories spread across North America. Yet all of them demonstrated how effective digital stewardship can be when community engagement is built into the planning of a project rather than treated as a final step at the end.
The Historically Black Colleges and Universities (HBCU) Digital Library trust session outlined a fantastic model that was centered on providing long term support for HBCUs and their unique archival histories. Their emphasis on shared ownership reflected a great understanding of these institutions and their historical challenges trying to navigate limited resources, public scrutiny, and a society that too often worked against them. What stood out to me in particular was how intentional their approach felt. Rather than expecting HBCUs to adapt to them, they adapted to the HBCUs by meeting them where they were. The Trust, hosted by the Atlanta University Center’s Woodruff Library, focused on building capacity in ways that supported institutional autonomy and reflected the needs of the communities they were trying to serve. Their model felt refreshing, informed and grounded in culturally informed practices that support long term institutional resilience.
The Borderlands storytelling session approached their community engagement from another direction. Their work seemed shaped by the layered histories and cultural dynamics found in the U.S.-Mexico Borderlands and by the University of Arizona’s position as a Hispanic-Serving Institution (HSI) with ties to the region. Their presentation drew from movements, identities, and complex narratives that define the region as well as from the data intensive methods they were using to support the work. They spoke about their efforts mapping, visualizing, and other forms of data storytelling that were central to how researchers were interpreting that complexity. What especially stood out to me was how they treated their approach to “place” as more than a backdrop. It functioned as a structure that was allowed to shape the research itself and set the terms for how they partnered with their researchers. It felt rooted in the region in a way that kept the work responsive so that it could move across research, teaching, and student engagement while still staying grounded in the histories and contexts that give it direction.
Across both of the sessions, I found myself thinking about how our community and networks shape our digital memory work every day. The HBCU Digital Library Trust and the Borderlands initiative each operate within distinct historical and cultural environments, yet they are undeniably interconnected through their commitment to engagement shaped by the histories and needs of the communities they serve. Together, these sessions were a great illumination of how digital memory work is always anchored somewhere and shaped by places, relationships, and shared histories that give it meaning. For those hoping to steward this work, our role is to listen closely enough that those anchors guide the paths we build.
This is the one thousandth post to this blog in the 212 months since the first post. That is an average of 4.7 posts per month, or just over one per week, which is my long-term goal for the roughly half my time that isn't taken up with grand-parenting.
The 1000 posts have gained over 6.88M page views, 7.6% of which were for my EE380 Talk. Less publicized but popular posts get around 30K page views, well above the 6.9K average.
The only one of these statistics that I care about is the goal of a post a week. Having an audience is nice when it happens, but that's not why I'm writing. I write for myself, to understand not necessarily to communicate. Despite this, I'd like to thank those who read and comment.
Win free books from the January 2026 batch of Early Reviewer titles! We’ve got 227 books this month, and a grand total of 2,976 copies to give out. Which books are you hoping to snag this month? Come tell us on Talk.
The deadline to request a copy is Monday, January 26th at 6PM EST.
Eligibility: Publishers do things country-by-country. This month we have publishers who can send books to Canada, the US, the UK, Australia, Belgium, Netherlands, Poland, Latvia, Lithuania, Luxembourg and more. Make sure to check the message on each book to see if it can be sent to your country.
Thanks to all the publishers participating this month!
Hi DLF Community! I’ve really enjoyed connecting with so many of you at the Forum and in Working Group meetings over the past few months. Every conversation, formal and informal, has left me inspired and grateful to be part of a community fueled by care, creativity, and collaboration. I’m excited to keep learning with you all and stay in touch. If you want to chat one-on-one, just send me an email anytime (swillis@clir.org). Wishing you an encouraged, grounded start to 2026!
Closing Today, Call for Proposals: Digital Library Pedagogy Group (DLF Teach) has extended its toolkit CFP through end of day today; submit here.
Metadata Quality Benchmarks Announced: DLF-AIG Metadata Assessment Working Group (MWG) is pleased to announce the public release of benchmarks for metadata quality. Read about them on the DLF Blog.
Fellow Reflections: Starting tomorrow (January 6), look for reflections from the 2025 DLF Forum fellows on the DLF blog. Read past fellow reflections here.
Office closure: CLIR’s offices are closed on Monday, January 19, for Martin Luther King Jr. Day.
This month’s open DLF group meetings:
For the most up-to-date schedule of DLF group meetings and events (plus NDSA meetings, conferences, and more), bookmark the DLF Community Calendar. Meeting dates are subject to change. Can’t find the meeting call-in information? Email us at info@diglib.org. Reminder: Team DLF working days are Monday through Thursday.
DLF Digital Accessibility Working Group (DAWG): Tuesday, 1/6, 2pm ET / 11am PT
DLF Born-Digital Access Working Group (BDAWG): Tuesday, 1/6, 2pm ET / 11am PT
DLF AIG Cultural Assessment Working Group: Monday, 1/12, 1pm ET / 10am PT
AIG User Experience Working Group: Friday, 1/16, 11am ET / 8am PT
I’m a few days late with this post. Things have been busy with visiting family for the holidays, and we’ve been dealing with various house things since we moved. Of course, those are just excuses, since I’m managing to write this while I have a cold. Some people may have noticed that I didn’t write … Continue reading "2025 Blog Year in Review + Brief Update"
Developing a long-term illness, whether chronic or acute, is like being dropped into a country completely unfamiliar to you. You don’t know the language, the customs, the cuisine, the people. You feel alone, isolated, and totally out of your depth. Eventually, you start to learn the language, the customs. You find community, fellow travelers, people who can help you understand your new life better. It doesn’t stop being hard, but the learning curve becomes less steep and the isolation less intense.
However, unlike when you’re immersed in a new country and culture, you’re falling into this new place and experiencing that painfully slow acculturation while you’re trying to still live your regular life in parallel. You’re expected to be a good parent, partner, family member, friend, employee, housekeeper, bill-payer, etc. But you’re living in two different realities now and because of that, it’s easy to feel alienated from your regular life, especially if you don’t feel like you can bring that other part of yourself to your interactions at work, at home, or out with friends. The cognitive dissonance can be jarring.
It’s hard enough to live that double life, but adding in the vagaries of seeking out a diagnosis and often not being believed, not to mention coping with the symptoms themselves, can make life feel completely untenable. Before my autoimmune diagnosis, I spent more than a year seeing medical professionals who didn’t believe there was anything wrong with me other than the normal discomforts of aging. I kept asking doctors if they thought my symptoms could be autoimmune and was told “no” over and over again, though that felt wrong to me. One PA suggested that some of my symptoms might stem from anxiety since I have a history of anxiety (like I wouldn’t know at this point what anxiety feels like). Within five minutes of talking with the first rheumatologist I saw, after waiting five months for the appointment, he said to me “this doesn’t sound rheumatological at all.” Luckily he still did all the standard testing which showed that he was very wrong. But not being believed by so many doctors for so long stays with you. It leaves a scar. Every time I see a doctor now, I feel like I’m going to court and I’m ready to be cross-examined, to be picked apart. I’m a bundle of nerves.
And my experience is painfully common, especially for women, as poet Meghan O’Rourke writes in her amazing book about chronic illness, The Invisible Kingdom(a meditation on and journalistic exploration of chronic illness and how it is positioned in our social fabric):
And so it is a truth universally acknowledged among the chronically ill that a young woman in possession of vague symptoms like fatigue and pain will be in search of a doctor who believes she is actually sick. More than 45 percent of autoimmune disease patients, a survey by the Autoimmune Association found, “have been labeled hypochondriacs in the earliest stages of their illness.” Of the nearly one hundred women I interviewed, all of whom were eventually diagnosed with an autoimmune disease or another concrete illness, more than 90 percent had been encouraged to seek treatment for anxiety or depression by doctors who told them nothing physical was wrong with them. (p. 103)
Once I got on meds for my condition that finally started working (most first-line meds for autoimmune conditions take three months on average to produce any effects on the immune system), I thought I was past the worst of it. Other than occasional much smaller flares, I was essentially in remission. I learned my limits. I protected my spoons with my life. I kept my stress low. I felt like I had it figured out. I felt good even. And then I got sicker with new symptoms that have stolen so much from me, including my sleep. The past 10 months have honestly been a nightmare with a carousel of doctors who all have completely different theories of what is going on and with a condition that is constantly evolving so what they see in the moment isn’t the full picture. And each doctor I’ve seen hyperfocuses on something different and ignores every other aspect of my case. It’s all making me feel like I’m going crazy.
Each wrong diagnosis brought me to another country, another reality, another identity, that I lived in for a short while. And in each of these countries, I spent countless hours learning, learning, learning all I could, going down research and subreddit rabbit holes, and spending way too much money on products that did nothing because none of those diagnoses were correct. The dermatologist I see who specializes in autoimmune conditions at a research university seems to have given up even trying to diagnose me and she’s basically my last best hope in the state. She wouldn’t even give me differential diagnoses last time beyond “it’s clearly autoimmune given your systemic symptoms.” She’s the one who has put me on a serious immunosuppressant with debilitating side effects, which I guess at least shows she’s taking it seriously, but if she doesn’t know what she’s treating me for, how does she know that this drug that is making me feel terrible is even going to help? Atul Gawande said of doctors that “nothing is more threatening to who you think you are than a patient with a problem you cannot solve” (quoted in The Invisible Kingdom, page 209) and I feel that in how I’m treated at every appointment I go to. With the exception of the charlatan immunologist who was desperate to diagnose me with MCAS though there was no evidence in support of it, not one doctor has seemed at all interested in figuring out what this is – it’s felt more like a game of “not it.”
Of a similar liminal moment in her own illness, O’Rourke wrote, “in my illness I was moored in an unreachable northern realm, exiled to an invisible kingdom, and it made me angry. I wanted to rejoin the throngs. In dark moments I continued to wonder if the wrongness was me” (99). And of course people will feel like that wrongness is them when we live in a culture that views chronic illness as some sort of weakness or something we caused through through our own bad habits. Like O’Rourke, I feel both exiled from my world and forced to be in it at the same time, which is a unique form of torture. Going to work, pretending things are ok, doing my job, meeting deadlines, helping students, smiling, all the while my body is attacking itself, I’m barely sleeping, I’m spontaneously bleeding from my skin and under my skin, and I’m so itchy I sometimes have to wear gloves to bed or I’ll scratch myself raw in my sleep. You feel like you’re play-acting being yourself, being a person in the world, because you’re not really there anymore. And when you’re suffering, and don’t know what your illness is, and you feel abandoned, it’s easy to go down rabbit holes of self-loathing along with those rabbit holes of fruitless research that make you feel like an unhinged obsessive with a murder board and yarn. As Meghan O’Rourke wrote, “your sense of story is disrupted” (p. 259) and you feel like a stranger to yourself.
I started writing about slow librarianship long before I got really sick, but even then, I knew the importance of fostering a work culture where you can be a whole person. I knew how it felt to have a child and feel like you couldn’t prioritize family obligations over work ever (though working during family time? Totally ok, right?). In a workplace that encourages people to be whole people, workers feel like they can prioritize the things in their lives outside of work that are important – their caregiving responsibilities, their health, the people they love, etc. They feel like they can talk about these things – that they don’t make them liabilities. They can be vulnerable and real. And feeling like you can be vulnerable and real about who you are and how you’re doing means that you can also be vulnerable and real in your work, which makes us better employees who are energized to try new things.
I think a lot of people in positions of power might even want a culture like this, but very few actively create it. They might think that saying “take what time you need” when someone is facing illness is enough. But I think two pieces are missing from this. First, managers need to not only say “take what time you need” but work with their direct reports to address the work that would otherwise pile up. If you say “take all the time you need” but all the work with its stressors and deadlines is still there, you’re not really giving people space. Can you take good care of yourself while you watch the work pile up and up and up? How many of us have come back to work while still not fully recovered from an illness because of the work that was piling up or a class they needed to teach?
Also, managers need to model vulnerability, transparency, and being whole people themselves. If they put up a false front of strength, if they’re not willing to be vulnerable and human and real themselves, if they do not model transparency, there’s no way that others will feel safe doing so. I was lucky to have a boss in my first academic library job who was deeply human in her interactions with her employees, so I got to see what that looked like. And it was her humanity that engendered fierce loyalty in her employees – we all thought the world of her. Even when she made decisions that people didn’t like (which was rare as she really did take our insights to heart), she explained her thinking in a transparent way. Given my later experiences, her way of being feels vanishingly rare. I think a lot of managers feel like they need to project strength, not explain their decisions, not let their direct reports really know them as people with full lives, but I don’t think that’s true. A lot of managers operate out of a place of fear or insecurity, but my first academic library director was confident enough to be her full self, flaws and all.
In a culture where we don’t feel like we can bring ourselves fully to work, I don’t feel like I can talk about my illness. I feel selfish and weak for even considering it. Like, we all have shit going on, right? The world is pretty awful right now. People’s lives are complicated and messy and there’s probably a lot of suffering I know nothing about happening all around me. If they don’t talk about it, who am I to talk about it? I’m not special. While I’ve mentioned being sick at work in the context of being immunocompromised and needing to protect myself and not participate in large, crowded events, even that has felt really uncomfortable. Everyone should feel like they are important enough to their places of work and valued enough to bring up these things without feeling embarrassed or like they’re asking for “special treatment.” I read recently (can’t remember the source) that close to 60% of people with chronic illnesses have not told people at work about it. Imagine hiding something that is such a pivotal and ineluctable piece of many people’s identities and think about the double life that forces them to live.
At work I feel a lot of shame about being sick and I work more than I should given how I’ve been feeling (this is common). I feel like I need to mask how I’m really doing, that people don’t want to hear it. And it’s true that most don’t. There are three people at work I can talk to about my illness, but others seem so incredibly uncomfortable when I mention it, so I’ve learned to just pretend it’s all ok or say nothing. I know that some of my reticence and shame comes from my own internalized ableism as it’s the water we all swim in, but when I worked in that library where the culture encouraged vulnerability, humanity, and care, I remember how different it felt. How much less distance there was between the person I really was and the person I was at work.
In a meeting last year, our Dean was talking about making the next all-library meeting in-person only. Previously, they had always offered them hybrid, but she didn’t like that most people were choosing not to come in-person. And I totally get it, even though it sucks to always be the outlier. She wants it to be a team-building experience and that’s really hard to do when most people are participating from home with their cameras off. At that meeting, for the first time, I disclosed my illness in front of a bunch of people and talked about how important it is to always offer an online option for folks who are medically vulnerable or at least find ways to make indoor spaces safer for those who can’t afford to get sick. My boss then asked to meet with me to talk about how to make our spaces safer. I talked about airflow, encouraging and providing masks, and, during temperate months, having the meetings at places where windows and doors can remain open or even holding them outside (we’d had one meeting at a park a few years ago which had been the best one ever from both a health and team-building perspective). I suggested that we make the Winter meeting fully virtual since it’s the height of flu season and you can usually get people participating more in a fully virtual meeting than a hybrid one, where the online people feel like weird lurkers. I was thanked for my feedback and didn’t hear anything after that. This September, the all-library meeting was held in our campus library where the windows don’t open (albeit with a couple of HEPA filters scattered around, but I know we do have large college spaces where doors and windows can be opened because I went to an all-day union meeting in one where they did just that and we’d used that space for library meetings in the past) and our February meeting is going to be held in-person during the worst flu season in decades. Obviously, none of this was personal or intended to cause harm, but, at the same time, how should I feel under the circumstances? Clearly speaking out in that meeting, something that I had to really steel myself to do, had been pointless. Why would I ever bring it up or ask for anything again?
When we come back from winter break, people inevitably ask each other how it was, but do they really want to know? I think they want to hear “good,” “fun,” “restful,” etc. How do you talk about a “vacation” in which you spent most of it doubled over in pain after eating anything thanks to the toxic meds you have to take and your father-in-law was in the hospital dying the entire time? I wish that I felt I could share what an absolute shitshow it’s been, to feel like I could be a full person at work, but when you know no one really wants to hear it, when it just makes people uncomfortable, it becomes so much easier to smile and say “it was good!” and move on. Who wants to be a buzzkill?
Slow librarianship puts worker well-being over productivity and deadlines, allows workers to be whole people at work, and supports a culture of care. While a radical idea, this even makes good business sense because depleted and burned out workers have been shown to be a major drain on the organization and negatively impact the culture. If you’re a manager and you’re not actively fostering a culture where people can bring their whole selves to work, then you are fostering a culture where people do not feel safe being vulnerable and having needs. Workers, if you know a colleague is struggling with something (an illness, losing a loved one, a difficult caregiving situation, etc.) and you don’t check in to see how things have been going for them, you’re sending the message that you don’t want to hear about these things, that they make you uncomfortable, that they’re not appropriate to take to work. I think we’ve all probably been guilty of this at some point in our lives and maybe we even thought that not asking was the right thing to do. I can imagine some people think that asking is invasive or reminds the person that they are sick, but it is an expression of care. As Philip Hoover writes in his excellent Sick Times article entitled “You know someone with Long COVID. They need you to ask about it genuinely”
Approach us with empathy and curiosity. Ask questions that show a sincere desire to understand. How are you feeling this week? works because it acknowledges the chronic, fluctuating nature of my health. Or a version of Nunez’s question, and one I’ve longed to be asked since I’ve been ill: What has this been like for you?
If our response is tough to hear, try not to smother it in optimism. And tread lightly. While some long-haulers may appear okay in public, much of our suffering occurs in private, shade-drawn rooms, across lonely afternoons, stuck in bed. When in doubt, remember that the act of asking never hurts — but never being asked certainly does.
While I don’t have Long COVID, this piece so perfectly encapsulates how I feel as someone with a mostly invisible chronic illness who would just love to be asked “how are you feeling this week?” instead of feeling like I have to pretend I’m okay. I told my manager at the start of Fall term that my autoimmune disease had become significantly worse and that I didn’t know what my capacity might look like going forward. She expressed sympathy, told me to take what time I needed, and never checked in with me after that. That September, I was taking over a very important committee chair role that was made enormously more time-consuming and onerous by the departure of the three colleagues most involved in supporting this work (two of whom had more than 20 years of institutional knowledge locked up in their heads). I didn’t feel like I had the leeway or support to let things drop as more and more kept piling up on my plate related to my chair role and it became clear that I was expected to do a lot of onboarding for the new people in this role even though I was new to my role and was no one’s manager. While I know my boss is extraordinarily busy, the message that not checking in with how I was doing sent me was very different from what I assume she’d wanted to convey. Checking in with a colleague or direct report seems like such a small thing, and it is in terms of the effort it requires, but the impact it can have in making someone feel cared for and less like they have to live a painful double life is enormous.
We have been at this location for over 20 years as formerly Saigonese
Restaurant. The Wheaton area has changed dramatically over time as our
customers and their preferences. Our restaurant became more and
well-known good places to enjoy Vietnamese cuisines. After serious
considerations, with kind suggestions from our customers, we rebranded
to Pho and Banh Mi Saigonese.
Standard Ebooks is a volunteer-driven effort to produce a collection of
high quality, carefully formatted, accessible, open source, and free
public domain ebooks that meet or exceed the quality of commercially
produced ebooks. The text and cover art in our ebooks are already
believed to be in the U.S. public domain, and Standard Ebooks dedicates
its own work to the public domain, thus releasing the entirety of each
ebook file into the public domain. All the ebooks we produce are
distributed free of cost and free of U.S. copyright restrictions.
Every culture produces heroes that reflect its deepest anxieties. The
Greeks, terrified of both mortality and immortality, gave us Achilles.
The Victorians, haunted by social mobility, gave us the self-made
industrialist. And Silicon Valley, drunk on exponential curves and both
terrified and entranced by endless funding rounds, has given us the Hero
Developer: a figure who ships features at midnight, who “moves fast and
breaks things,” who transforms whiteboard scribbles into billion-dollar
unicorns through sheer caffeinated will.
We celebrate this person constantly. They’re on the front page of
TechCrunch et al. They keynote conferences. Their GitHub contributions
get screenshotted and shared like saintly relics.
Meanwhile, an unsung developer is updating dependencies, patching
security vulnerabilities, and refactoring code that the Hero Developer
wrote three years ago before moving on to their next “zero to one”
opportunity.
They will never be profiled in Wired.
But they’re doing something far more important than innovation.
No app did exactly what I needed, so I built my own personal finance
system using plain-text accounting principles and a powerful Python
library called Beancount. This post shows you how I handle imports,
investments, multi-currency, and a two-person view.
Today, Ruby 4.0 was released. What an exciting milestone for the
language!
This release brings some amazing new features like the experimental
Ruby::Box isolation mechanism, the new ZJIT compiler, significant
performance improvements for class instantiation, and promotions of Set
and Pathname to core classes. It’s incredible to see how Ruby continues
to thrive and be pushed forward 30 years after its first release.
To celebrate this release, I’m happy to announce that I’ve been working
on porting the Charmbracelet Go terminal libraries to Ruby, and today
I’m releasing a first version of them. What better way to make this Ruby
4.0 release a little more glamorous and charming?
I remembered that people have been working towards documenting the Mac
ROM startup tests and using them to diagnose problems, so I decided to
give it a shot and see if Apple’s Serial Test Manager could identify my
Performa’s issue. Where was the fault on this complicated board? Sure, I
could test a zillion traces by hand, but why bother when the computer
already knows what is wrong?
1925 was a watershed year for the recording industry. The Jazz Age was
in full swing and beginning in March, 1925, widespread adoption of
electrical recording meant greater fidelity and new realism for
recordings. DAHR documents over 11,000 recordings made in 1925–an
all-time high for the industry.
This is a screen recording of a 60 Minutes segment about the Centro de
Confinamiento del Terrorismo (CECOT) prison in El Salvador, which was
intended to be aired December 22, 2025 but was pulled last minute for
unclear reasons. Despite being pulled, it aired on Global-TV in Canada
anyway.
Cormac McCarthy, one of the greatest novelists America has ever produced
and one of the most private, had been dead for 13 months when I arrived
at his final residence outside Santa Fe, New Mexico. It was a stately
old adobe house, two stories high with beam-ends jutting out of the
exterior walls, set back from a country road in a valley below the
mountains. First built in 1892, the house was expanded and modernized in
the 1970s and extensively modified by McCarthy himself, who, it turns
out, was a self-taught architect as well as a master of literary
fiction.
I was invited to the house by two McCarthy scholars who were embroiled
in a herculean endeavor. Working unpaid, with help from other volunteer
scholars and occasional graduate students, they had taken it upon
themselves to physically examine and digitally catalog every single book
in McCarthy’s enormous and chaotically disorganized personal library.
They were guessing it contained upwards of 20,000 volumes. By
comparison, Ernest Hemingway, considered a voracious book collector,
left behind a personal library of 9,000.
uv is fast because of what it doesn’t do, not because of what language
it’s written in. The standards work of PEP 518, 517, 621, and 658 made
fast package management possible. Dropping eggs, pip.conf, and
permissive parsing made it achievable. Rust makes it a bit faster still.
The Post-Platform Digital Publishing Toolkit is an iterative digital and
print publication by Well Gedacht Publishing exploring how to overcome
the limitations of digital publishing on social media and other online
platforms, and advocates for self-hosted infrastructures and practices
for artists and artists’ book publishers. You can find the first
iteration of the print publication here.
Giambattista Vico (born Giovan Battista Vico /ˈviːkoʊ/; Italian:
[ˈviko]; 23 June 1668 – 23 January 1744) was an Italian philosopher,
rhetorician, historian, and jurist during the Italian Enlightenment. He
criticized the expansion and development of modern rationalism, finding
Cartesian analysis and other types of reductionism impractical to human
life, and he was an apologist for classical antiquity and the
Renaissance humanities, in addition to being the first expositor of the
fundamentals of social science and of semiotics. He is recognised as one
of the first Counter-Enlightenment figures in history.
Commercial robots have widespread and exploitable vulnerabilities that
can allow hackers to take over within hours or even minutes, according
to Chinese cybersecurity experts.
Security in the robotics industry is “riddled with holes,” said Xiao
Xuangan, who works at Darknavy, an independent cybersecurity research
and services firm based in Singapore and Shanghai. Xiao noted that when
testing low-level security issues in quadruped robots, his team gained
control of one of Deep Robotics’ Lite-series products in just an hour.
Better late than never, right? This review of WS-DL's 2024 is incredibly late, but some family concerns delayed my writing and then I never quite got back on track. We had quite a productive 2024, graduating a record three MS students and four PhD students.
Students and Faculty
We did not add or lose any faculty this year, but Dr. Jayarathna received tenureearly! Congratulations to Sampath!
We graduated four PhD students:
Bathsheba Farrow defended her dissertation on 2024-06-28. Bathsheba already had a position with the Naval Surface Warfare Center, and will continue with them after her graduation.
Muntabir Hasan Choudhury defended his dissertation on 2024-11-06. Muntabir took a research fellow position at the Food and Drug Administration (FDA).
Congratulations to Dr. Bathsheba Farrrow @sheissheba for successfully defending her dissertation "A Microservices Approach to EEG Research in the Public Cloud" She is the very first student from the @NirdsLab research group @WebSciDL@oducs to defend the Ph.D. pic.twitter.com/K5wDRa7qu4
Congratulations to Dr. Yasith Jayawardana @yasithdev for successfully defending his doctoral dissertation "A Realtime Biosignal Processing Framework for Lab Scale Experimentation." Second Ph.D to come out of @NirdsLab research team @WebSciDL@oducs@ODUSCI. pic.twitter.com/zMYQ9Tq6KP
Dominik Soós defended his MS thesis and joined the PhD program.
Lesley Frew defended her MS thesis and joined the PhD program.
My student Dominik Soós successfully defended his Master's thesis today. His thesis title is "Who Wrote the Scientific News? Improving the Discernibility of LLMs to Human-Written Scientific News". Thanks @vikas_daveb@Meng_CS. Dominik will be a PhD student in Fall 2024 @WebSciDLpic.twitter.com/7yVXdoOT0w
To generate our annual publication list, we use our tool "Scholar Groups", which scrapes Google Scholar profiles and merges and deduplicates publications. As such, our list is limited by the accuracy of Google Scholar, which is pretty good but not perfect. It looks like for 2024 we published about 28 refereed conference papers, 12 journal articles, and one patent (congratulations, Dr. Ashok!).
Conferences have mostly returned to f2f, but frequently there are still virtual/remote options. Below is a partial list of trip reports for the events where we presented our work:
In addition to the conferences and workshops listed above where we presented papers, we also had an array of presentations and outreach.
We hosted the third and final year of our NSF Disinformation Detection and Analytics Research Experiences for Undergraduates (REU) Program. The cohort of the third year was especially successful, as reflected in the mid-point and final presentations. As you can see from the list above, many of the REU projects resulted in publications.
We also had our 5th annual "Trick or Research" event. Dr. Jayarathna initiated the event five years ago and the entire department has embraced it.
Dr. Jayarathna gave an invited talk at Ocean Lakes High School (2024-10-16)
Good to see our friend Professor Herzog @maherzog during his annual visit @odu. We had a nice lunch at the Webb Center, got a chance to exchange some ideas, and met our @NirdsLab@WebSciDL students during the weekly lab meeting. pic.twitter.com/Ry0rr99KzJ
Our scholarly contributions are not limited to conventional publications or presentations: we also advance the state of the art through releasing software, data sets, and proof-of-concept services & demos. Some of the software, data sets, and services that we either initially released or made significant updates to in 2024 include:
Dr. Jayarathna was Senior Faculty Fellow, Office of Naval Research Summer Faculty Program, at Naval Surface Warfare Center Dahlgren Division, Dam Neck Activity during the summer
I am honored to be awarded the 2024 Provost's Outstanding Undergraduate Research Mentor of the Old Dominion University. Thanks President Hemphill and Provost Agho. @WebSciDL@oducs@ODUSCI@ODUpic.twitter.com/sAl2xiM2Dh
2024 was a strong year for us: four PhD and three MS students graduated, three new PhD students, and six PhD students advancing their status. One of our faculty members, Dr. Sampath Jayarathna, received tenure. We continued to publish in prestigious venues, with about 40 refereed publications. We helped generate just over $7M in new external funds, from six different grants. WS-DL continues to grow and thrive, and I am proud of all the members and alumni and their progress in 2024.
If you would like to join WS-DL, please get in touch. To get a feel for our recent activities, please review our previous WS-DL annual summaries (2023, 2022, 2021, 2020, 2019, 2018, 2017, 2016, 2015, 2014, and 2013) and be sure to follow us at @WebSciDL to keep up to date with publications, software releases, trip reports and other activities. We especially would like to thank all those who have publicly complimented some aspect of the Web Science and Digital Libraries Research Group, our members, and the impact of our research.
–Michael
Congratulations to All three Dr. J's from the @NirdsLab Dr. Bathsheba Jackson @sheissheba , Dr. Gavindya Jayawardena @Gavindya2 , and Dr. Yasith Jayawardana. @yasithdev. @WebSciDL PhD Crush board updated, just waiting in the border of alumni cloud until the paperwork is done! pic.twitter.com/dwEMMzOpy5
After the defense, @lesley_elis continued @WebSciDL's tradition of students sharing a hometown meal with us. Lesley's Philly roots showed up in the cheesesteaks (made authentic with Cheez Whiz), @Tastykake, birch beer soda, and @GrittyNHL decorations. Congrats again, Lesley! 🎉🎓 pic.twitter.com/WP8Ny1d2BY
I’m glad we’ve reached a new Public Domain Day, and that the works I’ve been featuring in my #PublicDomainDayCountdown, and many more, are now free to copy and reuse. I’ve been posting about works joining the public domain in the United States, which include sound recordings published in 1925, and other works published in 1930 that had maintained their copyrights. (Numerous works from 1930, and later, that had to renew their copyrights, and did not, were already in the public domain, though many of the best-known works did renew copyrights as required.) This is the eighth straight year Americans have seen a year’s worth of works join the public domain, after a 20-year freeze following a 1998 copyright extension.
I intend my countdown not just to celebrate the works joining the public domain, but also to celebrate what people have done with those works. In some posts, I note later creations based on those works. In nearly all my posts, I link to things that people have written about those works. Like the works themselves, those responses may have flaws or quirks, but I value them as human reactions to human creations. Whether they’re reviews, personal blog posts, professionally written essays, scholarly analyses, or Wikipedia articles, they’re created by people who encountered an interesting work and cared about it enough to craft a response to it and share it with the world. Those shared responses in turn pique my interest in the writers and the works.
It wasn’t always easy for me to find such responses online. Sometimes I’d go searching for responses to a promising-sounding work, and only find sales listings on e-commerce sites, social media posts not easily linkable or displayable without logging into a commercial platform, paywalled articles that many of my readers can’t view, or generic-sounding pages that read like they were generated by a large language model or a content farm, but not by anyone who I could clearly tell cared about or even read the work in question. Some works I initially hoped to feature got left off my countdown, replaced by other works where I could more readily link to an interesting response.
The people publishing the responses I link to are often swimming against a strong current online. Many online writing systems– including the one I’ve been writing these posts on— are now urging their users to “improve” their posts by letting “AI” write them. Some writers may be tempted to allow it, when facing an impending deadline or writer’s block or anxiety, even when the costs can include muffling one’s own voice, signing onto falsehoods confidently stated by a stochastic text generator, or abusively exploiting existing content and services. Other writers may feel pushed to put their work behind paywalls or other access controls that makes them less likely to be plagiarized or aggressively crawled by those same “AI” systems. And most writers, myself included, find it easy to dash off a quick short take on a social media platform, be quickly gratified by some “like”s, and then have it forgotten. It’s harder to take the time to craft something longer or more thought-out that will be readable for years, and that might take much longer for us to hear appreciated. The easy alternatives can discourage people from devoting their time to better, more lasting creations.
As I’ve noted before, both copyright and the public domain serve important purposes in encouraging the creation, dissemination, sharing, and reuse of literature and art. One reason I write my public domain posts is to promote a better balance between them, particularly in encouraging shorter copyright lengths to benefit both original creators and the public. Similarly, as I’ve noted in another recent post, I value both human creation and automated processes, but I increasingly see a need to improve the balance between those as well, especially as some corporations aggressively push “generative AI”. While I appreciate many ways in which automation can help us create and manage our work, I treasure the humanity that people thoughtfully put into the creation of literature and art of all kinds, and the human responses that those creations elicit.
Today I’m thankful for all of the people, most no longer with us, who made the works that are joining the public domain today. I’m thankful for the new opportunities we have to share and build on those works now that they’re public domain. I’m thankful to all the people who have responded to those works, whether as brief reactions or as new works as ambitious as the works they respond to. And I hope you’ll keeping making and sharing those responses with the world when you can. I look forward to reading them, and perhaps linking to them in future posts.
Happy Public Domain Day! You might hear people say that books published in 1930 have "fallen" into the US Public Domain, or, that they have lost copyright "protection". This is not quite correct. Rather, books published in 1930 have been FREED of copyright restrictions. They have ASCENDED into the public domain and into the embrace of organizations like Project Gutenberg. They now belong to ALL of us, and we need to take care of them for future generations.
On October 21, Project Gutenberg lost its longtime leader, Greg Newby, to pancreatic cancer. I had agreed to step up as Acting Executive Director so that Project Gutenberg could continue the mission that had become Greg's life work: to serve and preserve public domain books so that all of us can use and enjoy them without restrictions. Although I've been doing development work for Project Gutenberg for the past 8 years, I did not really understand what Greg's job entailed, or how many tasks he had been juggling. Three months in, I'm still discovering mysterious-to-me aspects of the organization. I've also been amazed at the dedication and talent of the many volunteers behind Project Gutenberg and our sister organization, Distributed Proofreaders. And at the large number of donors who make the organization financially viable and sustainable. So as of 2026, with your support, I'm continuing as Executive Director.
In the past three months Project Gutenberg has proven to be resilient; we took a heavy blow and managed to keep going. My top priority going forward is to make Project Gutenberg even more sustainable as well as resilient. In other words, my job is be one runner in a relay race: take the baton and make sure I get it to the next runner. That's what we all have to do with public domain books, too. We want them to still be there in 50 years! Whether you're already a volunteer or booster, an avid reader, or just someone curious about what we do, I hope you'll help us pass that baton.
showed that (i) a successful block-reverting attack does not necessarily require ... a majority of the hash power; (ii) obtaining a majority of the hash power ... costs roughly 6.77 billion ... and (iii) Bitcoin derivatives, i.e. options and futures, imperil Bitcoin’s security by creating an incentive for a block-reverting/majority attack.
It is worth noting that they are not talking about profiting from double-spending. The Bitcoin blockchain transacts around $17B/day of nominal value in around 450K transactions (average ~$38K), but in 2021 Igor Makarov & Antoinette Schoar found that:
90% of transaction volume on the Bitcoin blockchain is not tied to economically meaningful activities but is the byproduct of the Bitcoin protocol design as well as the preference of many participants for anonymity ... exchanges play a central role in the Bitcoin system. They explain 75% of real Bitcoin volume.
Of course, just because they aren't "economically meaningful" doesn't mean they aren't worth attacking! The average block has ~3.2K transactions, so ~$121.6M/block. As a check. $121.6M * 144 block/day = $17.5B. So to recover their cost for a 51% attack would require double-spending about 8 hours worth of transactions.
I agree with their technical analysis of the attack, but I believe there would be significant difficulties in putting it into practice. Below the fold I try to set out these difficulties.
First, I should point out that I wrote about using derivatives to profit from manipulating Bitcoin's price more than three years ago in Pump-and-Dump Schemes. These schemes have a long history in cryptocurrencies, but they are not the attack involved here. I don't claim expertise in derivatives trading, so it is possible my analysis is faulty. If so, please point out the problems in a comment.
The key idea behind this strategy, called Selfish Mining, is for a pool to keep its discovered blocks private, thereby intentionally forking the chain. The honest nodes continue to mine on the public chain, while the pool mines on its own private branch. If the pool discovers more blocks, it develops a longer lead on the public chain, and continues to keep these new blocks private. When the public branch approaches the pool's private branch in length, the selfish miners reveal blocks from their private chain to the public.
...
We further show that the Bitcoin mining protocol will never be safe against attacks by a selfish mining pool that commands more than 1/3 of the total mining power of the network. Such a pool will always be able to collect mining rewards that exceed its proportion of mining power, even if it loses every single block race in the network. The resulting bound of 2/3 for the fraction of Bitcoin mining power that needs to follow the honest protocol to ensure that the protocol remains resistant to being gamed is substantially lower than the 50% figure currently assumed, and difficult to achieve in practice.
Given that the rule of thumb followed by most practitioners is to wait for 6 confirmations, a fork that goes 6 levels deep can very likely diminish the public’s trust in Bitcoin and cause a crash in its market price. It is also widely accepted that a prolonged majority attack (if it happens) would be catastrophic to the cryptocurrency and can cause its downfall.
But, as they lay out, this possibility is discounted:
The conventional wisdom in the blockchain community is to assume that such block-reverting attacks are highly unlikely to happen. The reasoning goes as follows:
Reverting multiple blocks and specifically double-spending a transaction that has 6 confirmations requires control of a majority of the mining power;
Having a majority of the mining power is prohibitively expensive and requires an outlandish investment in hardware;
Even if a miner, mining pool or group of pools does control a majority of the mining power, they have no incentive to act dishonestly and revert the blockchain, as that would crash the price of Bitcoin, which is ultimately not in their favor, since they rely on mining rewards denominated in BTC for their income.
Source
Starting in late 2020, as shown in The Economist's graphic, the spot market in Bitcoin became dwarfed by the derivatives markets. In the last month $1.7T of Bitcoin futures traded on unregulated exchanges, and $6.4B on regulated exchanges. Compare this with the $1.8B of the spot market in the same month.
These huge futures markets enable Farokhnia & Goharshady's attack:
In short, an attacker can first use the Bitcoin derivatives market to short Bitcoin by purchasing a sufficient amount of put options or other equivalent financial instruments. She can then invest any of the amounts calculated above, depending on the timeline of the attack, to obtain the necessary hardware and hash power to perform the attack. If the attacker chooses to obtain a majority of the hash power, her success is guaranteed and she can revert the blocks as deeply as she wishes. However, she also has the option of a smaller upfront investment in hardware in exchange for longer wait times to achieve a high probability of success. In any case, as long as her earnings from shorting Bitcoin and then causing an intentional price crash outweighs her investments in hardware, there is a clear financial incentive to perform such an attack. The numbers above show that the annual trade volume in Bitcoin derivatives is more than three orders of magnitude larger than the required investment in hardware. Thus, it is possible and profitable to perform such an attack.
We only consider the cost of hardware at the time of writing. We assume the attacker is buying the hardware, rather than renting it and do not consider potential discounts on bulk orders.
We ignore electricity costs as they vary widely based on location.
The justification for the first assumption is that it keeps our analysis sound, i.e. we can only over-approximate the cost by making this assumption. As for the second assumption, we note that electricity costs are often negligible in comparison to hardware costs and that our main argument, i.e. the vulnerability of Bitcoin to majority attacks and block-reverting attacks, remains intact even if the estimates we obtain here are doubled. Indeed, as we will soon see, the trade volume of Bitcoin derivatives is more than three orders of magnitude larger than the numbers obtained here.
Goal
As Farokhnia & Goharshady stress, the success of a block-reverting attack is probabilistic, so the attacker needs to have a high enough probability of making a large enough profit to make up for the risk of failure.
My analysis thus assumes that the goal of the attacker is to have a 95% probability of earning at least double the cost of the attack.
Attacker
There are two different kinds of attackers with different sets of difficulties:
Outsiders: someone who has to acquire or rent sufficient hash power.
Insiders: someone or some mining pool who already controls sufficient hash power.
Farokhnia & Goharshady study the outsider case. Both kinds of attacker's practical problems occur in two areas:
Obtaining and maintaining for the duration of the attack sufficient hash power without detection.
Obtaining and maintaining for the duration of the attack a sufficient short position in Bitcoin without detection.
The short position must be maintained for the duration of the attack because succeess may come at any 10-minute block time, and there would not be time to obtain a large enough short position in ten minutes.
Hash Power
The outsider's problems are more complex than the insider's.
Outsider Attack
The outsider attacker requires three kinds of resource:
Mining rigs.
Power to run the rigs.
Data center space to hold the rigs.
Each of these is problematic, but assuming that the difficulties could be overcome, there is then the question of what it would cost to run the attack..
Mining rigs
Could they acquire mining rigs sufficient to provide 30% of the combined insider and outsider hash power, or ~43% of the pre-attack hash power?
How long would it take to acquire the rigs?
Would their acquisition of the rigs be detected?
Bitmain is estimated to have 82% of the market for mining rigs, and they either control or have very close relations with all the major mining pools, who thus have priority access to the latest rigs. Because rigs depreciate rapidly, position in the queue for rigs has a big impact on the profitability of mining. Bitmain is unlikely to give a new customer priority access to rigs.
Because the economic life of mining rigs is less than two years, the first part of Bitmain's production goes into maintaining the hash rate by replacing obsolete rigs. The second part goes into increasing the hash rate. If we assume that the outsider attacker could absorb the second part of Bitmain's production, how long would it take to get the necessary 43% of the previous hash power?
This can be estimated by examining the hash power through time graph. Over the last 3 years the hash rate has increased from about 240EH/s to about 1120EH/s, or about 24EH/s/month. Roughly, 82% of this is Bitmain's output, or about 20EH/s/month. The attacker needs 43% of the current hash rate, or about 482EH/s, or 24 months of the second part of Bitmain's production. At the current price for leading-edge rigs of $14.11/TH/s this would cost about $6.8B plus say $340M in interest at 5%, or $7.14B.
The lack of rigs to increase the hash rate over a period of much less than two years would clearly be detectable.
Power
The Cambridge Bitcoin Energy Consumption Index's current estimate is that the network consumes 22GW. The outside attacker would need 43% of this, or about 9.5GW, for the duration of the attack. For context, Meta's extraordinarily aggressive AI data center plans claim to bring a single 1GW data center online in 2026, and the first 2GW phase of their planned $27B 5GW Louisiana data center in 2030. The constraint on the roll-out is largely that lack of access to sufficient power. The attacker would need double the power Meta's Louisiana data center plans to have in 2030.
Access to gigawatts of power is available only on long-term contracts and only after significant delays.
Meta's 5GW Louisiana "Hyperion" data center's "footprint will be large enough to cover most of Manhattan", and the outsider attacker would need two of them. If Meta expects to take more than 5 years to build one of them, the outsider attacker is likely to need a decade.
Estimates for AI data centers are that 60% of the capital cost is the hardware and 40% everything else. Thus the "everything else" for Meta's $27B 5GW data center is $10.8B. "Everything else" for the attacker's two similar data centers would thus be $21.6B. Plus say 5 years of interest at 5% or $5.4B.
Operational cost
Ignoring the evident impossibility of the outsider attacker amassing the necessary mining rigs, power and data center space, what would the operational costs of the attack be?
It is hard to estimate the costs for power, data center space, etc. But an estimate can be based upon the cost to rent hash power, noting that in practice renting 43% of the total would be impossible, and guessing that renters have a 30% margin. A typical rental fee would be $0.10/TH/day so the costs might be $0.07/TH/day. The attack would have a 95% probability of needing 482EH/s over 34 days or less, so $516M or less.
Thus the estimated total cost for the hash power used in the attack would have a 95% probability of being no more than $7.66B. Plus about $27B in data center cost, which could presumably be repurposed to AI after the attack.
The insider attacker already controls the 30% of the hash power they need, so only the question of detection remains. The essence of the block-reverting attack is that the attacker mines in secret until they can publish a chain with 6 blocks following a target block. A reduction of 30% of the public hash rate over an average period of 17 days would clearly be detectable. The hash rate is noisy, but the graph shows that over the last year the largest drop was 16% from June 14th to 27th. There was one large drop in the hash rate, 51% between May 10th and July 1st 2021 as China cracked down on mining.
The insider's loss of income from the blocks they would otherwise have mined would have a 95% probability of being 4,590 BTC or less, or about $425M.
Short Position
Both kinds of attackers need to ensure that, when the attack succeeds, they have a large enough short position in Bitcoin that would generate their expected return from the attack's decrease in the Bitcoin price. There are two possibilities:
When the attacker's chain is within one block of being the longest, they have ten minutes to purchase the shorts. There is unlikely to be enough liquidity in the market to accommodate this sudden demand, which in any case would greatly increase the price of the shorts. I will ignore this possibility in what follows.
At the start of the attack the attacker gradually accumulates sufficient shorts. Even assuming there were enough liquidity, and that the purchases didn't increase the price, the attacker has to bear both the cost of maintaining the shorts for the duration of the attack, and the risk of the market moving up enough to cause the position to be liquidated.
The success of a block-reverting attack on Bitcoin would have implications on other cryptocurrencies. It would likely increase the prices of Proof-of-Stake coins such as Ethereum, as being much more difficult to attack, and decrease the price of other Proof-of-Work coins. Derivatives on these coins might be included in the attacker's toolkit, but I will ignore this possibility as the open interest on these coins is smaller.
At the time of writing, the open interest of BTC options is a bit more than 20 billion USD. Thus, a malicious party performing the attack mentioned in this work would need to obtain a considerable amount of the available put contracts. This may lead to market disruptions whose analysis is beyond the scope of this work. This being said, if the derivatives market continues to grow and becomes much larger than it currently is, purchasing this amount of contracts might not even be detected.
There are two different kinds of market in which Bitcoin shorts are available:
Regulated exchanges such as the CME offering options on Bitcoin and stock exchanges with Bitcoin ETFs and Bitcoin treasury companies such as Strategy.
Unregulated exchanges such as Binance offering "perpetual futures" (perps) on Bitcoin.
Unregulated Exchanges
Patrick McKenzie's Perpetual futures, explained is a clear and comprehensive description of the derivative common on unregulated exchanges:
Instead of all of a particular futures vintage settling on the same day, perps settle multiple times a day for a particular market on a particular exchange. The mechanism for this is the funding rate. At a high level: winners get paid by losers every e.g. 4 hours and then the game continues, unless you’ve been blown out due to becoming overleveraged or for other reasons (discussed in a moment).
Consider a toy example: a retail user buys 0.1 Bitcoin via a perp. The price on their screen, which they understand to be for Bitcoin, might be $86,000 each, and so they might pay $8,600 cash. Should the price rise to $90,000 before the next settlement, they will get +/- $400 of winnings credited to their account, and their account will continue to reflect exposure to 0.1 units of Bitcoin via the perp. They might choose to sell their future at this point (or any other). They’ll have paid one commission (and a spread) to buy, one (of each) to sell, and perhaps they’ll leave the casino with their winnings, or perhaps they’ll play another game.
Where did the money come from? Someone else was symmetrically short exposure to Bitcoin via a perp. It is, with some very important caveats incoming, a closed system: since no good or service is being produced except the speculation, winning money means someone else lost.
So the exchange makes money from commissions, and from the spread against the actual spot price. The price of the perp is maintained close to the spot price by the "basis trade", traders providing liquidity by shorting the perp and buying the spot when the perp is above spot, and vice versa. Of course, the spot price itself may have been manipulated, for example by Pump-and-Dump Schemes.
Perp funding rates also embed an interest rate component. This might get quoted as 3 bps a day, or 1 bps every eight hours, or similar. However, because of the impact of leverage, gamblers are paying more than you might expect: at 10X leverage that’s 30 bps a day.
In a standard U.S. brokerage account, Regulation T has, for almost 100 years now, set maximum leverage limits (by setting minimums for margins). These are 2X at position opening time and 4X “maintenance” (before one closes out the position). Your brokerage would be obligated to forcibly close your position if volatility causes you to exceed those limits.
Although these huge amounts of leverage greatly increase the reward from a small market movement in favor of the position, they greatly reduce the amount the market has to move against the position before something bad happens. The first bad thing is liquidation:
One reason perps are structurally better for exchanges and market makers is that they simplify the business of blowing out leveraged traders. The exact mechanics depend on the exchange, the amount, etc, but generally speaking you can either force the customer to enter a closing trade or you can assign their position to someone willing to bear the risk in return for a discount.
Blowing out losing traders is lucrative for exchanges except when it catastrophically isn’t. It is a priced service in many places. The price is quoted to be low (“a nominal fee of 0.5%” is one way Binance describes it) but, since it is calculated from the amount at risk, it can be a large portion of the money lost. If the account’s negative balance is less than the liquidation fee, wonderful, thanks for playing and the exchange / “the insurance fund” keeps the rest, as a tip.
The bigger and faster the market move, the more likely the loss exceeds your collateral:
In the case where the amount an account is negative by is more than the fee, that “insurance fund” can choose to pay the winners on behalf of the liquidated user, at management’s discretion. Management will usually decide to do this, because a casino with a reputation for not paying winners will not long remain a casino.
But tail risk is a real thing. The capital efficiency has a price: there physically does not exist enough money in the system to pay all winners given sufficiently dramatic price moves. Forced liquidations happen. Sophisticated participants withdraw liquidity (for reasons we’ll soon discuss) or the exchange becomes overwhelmed technically / operationally. The forced liquidations eat through the diminished / unreplenished liquidity in the book, and the magnitude of the move increases.
Risk in perps has to be symmetric: if (accounting for leverage) there are 100,000 units of Somecoin exposure long, then there are 100,000 units of Somecoin exposure short. This does not imply that the shorts or longs are sufficiently capitalized to actually pay for all the exposure in all instances.
In cases where management deems paying winners from the insurance fund would be too costly and/or impossible, they automatically deleverage some winners.
So perhaps you understood, prior to a 20% move, that you were 4X leveraged. You just earned 80%, right? Ah, except you were only 2X leveraged, so you earned 40%. Why were you retroactively only 2X? That’s what automatic deleveraging means. Why couldn’t you get the other 40% you feel entitled to? Because the collective group of losers doesn’t have enough to pay you your winnings and the insurance fund was insufficient or deemed insufficient by management.
In theory, this can happen to the upside or the downside. In practice in crypto, this seems to usually happen after sharp decreases in prices, not sharp increases. For example, October 2025 saw widespread ADLing as (more than) $19 billion of liquidations happened, across a variety of assets.
How does this affect the outsider attacker? Lets assume that the attack has a 95% probability of costing no more than $7.5B and would reduce the Bitcoin price from $100K to $80K in a single 4-hour period. With 10X leverage this would generate $200K/BTC in gains.
The outsider wants to double the cost of the attack, so needs to short $15B/$180K BTC, or 83,333BTC at 10X leverage for the duration of the attack. Establishing the position costs $8.333B. Assuming the BTC price is fixed at $100K until the attack succeeds the funding rate is zero. But we have to assume that the attacker borrowed the $8.333B for the duration, so would pay interest, plus two commissions plus two spreads. I'll ignore these costs.
I will also ignore the fact that $83B is around 148% of the peak aggregated open interest in Bitcoin options over the past year of about $56B.
The way liquidation of a short works is that as the market moves up, the initial leverage increases. Each exchange will have a limit on the leverage it will allow so, allowing for the liquidation fee, if the leverage of the short position gets to this limit the exchange will liquidate it.
Move %
Leverage
0
10
1
11.1
2
12.5
3
14.3
4
16.7
5
20
6
25
7
33.3
8
50
9
100
The table shows the effect of increasing percentage moves against an initial 10X leveraged short. If we assume a short with an initial 10X leverage and an exchange limit of 50X was taken out on the first of each month of 2025, on 9 of the 12 months it would have been liquidated before the month was out. So Bitcoin is volatile enough that the attacker's short has a high probability of being liquidated before the attack succeeds. And note Binance's "nominal fee" of 0.5% for liquidating $83.33B, or $417M.
In the unlikely event that the attack succeeds early enough to avoid liquidation there would have been one of those "sharp decreases in prices" that cause ADL, so as a huge winner it would be essentially certain that the attacker would suffer ADL and most of the winnings needed to justify the attack would evaporate.
Regulated Exchanges
The peak open interest in Bitcoin futures on the Chicago Mercantile Exchange over the past year was less than $20B, so even if we add together both kinds of exchange, the peak open interest over the last year isn't enough for the attacker.
Conclusions
Neither an outsider nor an insider attack appears feasible.
Outsider Attack
An outsider attack seems infeasible because in practice:
They could not acquire 43% or more of the hash power.
Even if they could it would take so long as to make detection inevitable.
Even if they could and they were not detected, the high cost of the rigs makes the necessary shorts large relative to the open interest, and expensive to maintain.
These large shorts would need to be leveraged perpetual futures, bringing significant risks of loss of collateral through liquidation, and of the potential payoff being reduced through automatic de-leveraging.
The attacker would need more than the peak aggregate open interest in Bitcoin futures over the past year.
Insider Attack
The order-of-magnitude lower direct cost of an insider attack makes it appear less infeasible, but insiders have to consider the impact on their continuing mining business. If the assumed 20% drop in the Bitcoin price were sustained for a year, the cost to the miner controlling 30% of the hash rate would be about 15,750 BTC or nearly $1.5B making the total cost of the attack (excluding the cost of carrying the shorts) almost $2B.
The drop in Bitcoin's price and the smaller, lagging drop in network difficulty over the last three months has decreased miners' revenue by about 25%. In the medium term a further drop is in prospect. Sometime in April 2028 the regular Bitcoin halvening will occur, halving the income of miners in aggregate Bitcoin terms.
mining-company stocks are still flying, even with cryptocurrency prices in retreat. That's because these firms have something in common with the hottest investment theme on the planet: the massive, electricity-hungry data centers expected to power the artificial-intelligence boom. Some companies are figuring out how to remake themselves as vital suppliers to Alphabet, Amazon, Meta, Microsoft and other "hyperscalers" bent on AI dominance.
...
Miners often have to build new, specialized facilities, because running AI requires more-advanced cooling and network systems, as well as replacing bitcoin-mining computers with AI-focused graphics processing units. But signing deals with miners allows AI giants to expand faster and cheaper than starting new facilities from scratch.
...
Shares of Core Scientific quadrupled in 2024 after the company signed its first AI contract that February. The stock has gained 10% this year. The company now expects to exit bitcoin mining entirely by 2028.
I wonder why the date is 2028! As profit-driven miners use their bouyant stock price to fund a pivot to AI the hash rate and the network difficuty will decrease, making an insider attack less infeasible. The drop in their customer's income will likely encourage Bitmain to similarly pivot to AI, devoting an increasing proportion of their wafers to AI chips, especially given the Chinese government's goal of localizing AI.
A 30% miner whose rigs were fully depreciated might consider an insider attack shortly before the halvening as a viable exit strategy, since their future earnings from mining would be greatly reduced. But they would still be detected.
Counter-measures
Even if we assume the feasibility of both the hash rate and the short position aspects of the attack, it is still the case that for example, an attack with 30% of the hash power and a 95% probability of success will, on average, last 17 days. it seems very unlikely that the coincidence over an extended period of a large reduction in the expected hash rate and a huge increase in short interest would escape attention from Bitcoin HODl-ers, miners and exchanges, not to mention Bitmain. What counter-measures could they employ?
The theoretically correct counter-measure would be to raise the 6-block finality criterion to the 24 blocks that corresponds to a pool with 30% of the hash power. But this would violate what people incorrectly believe is the revealed word of Satoshi. And Goharshady correctly pointed out in email that this is in any case impractical:
The 6-block rule is just a convention, there is no dial that can be turned.
Much of the access to the Bitcoin blockchain is via APIs that typically have the 6-block rule hard-codded in.
Many, typically low-value, transactions do not wait for even a single confirmation.
Even it were possible, changing from a one-hour to a four-hour confirmation would have significant negative impacts on the Bitcoin ecosystem.
In the case of an insider attack, the absence of a pool previously mining around one in three of all blocks would readily de-anonymize the attacker. Bitmain would necessarily be aware of the identity of an outside attacker. Although unregulated exchanges are notoriously poor at KYC/AML, the sums involved in the shorts are so large that they would be highly motivated to use the blockchain information to de-anonymize the attacker. Given their terms of service, and the lack of effective recourse, they would be able to ham-string the attack.
Acknowledgements
This post benefited greatly from insightful comments on a draft from Jonathan Reiter, Amir Kafshdar Goharshady and Joel Wallenberg, but the errors are all mine.
I don’t think any of us went into 2025 thinking this would be an easy year, and boy wasn’t it. Rather than restate our collective challenges, I’m going to stick to my own little life and keep it short with bullet points and pictures. I’ll also list as many positives as I can, because even in the darkest of times, there are sources of joy and reasons to be grateful.
Real life, in no particular order
(OK, there’s some order, let’s do the hard one first) My mom passed away in late October – our relationship was complicated, and so are my feelings, but I’m working through it all with a therapist
(Bittersweet) I adopted Mom’s green cheek conure, Tutu (which we jokingly spell “Teauxtu,” thanks to my brother), who bonded to me quickly and thoroughly, but who is currently plucking all of his feathers anyway — we’re working on it with his vet, and I’m hopeful we’ll get him past this (though I’ll love him anyway, even if he’s a naked bird forever; I cannot overstate how sweet a little guy he is!)
My brother got married to a really nice lady, and I’m so happy for them!
In early October, we moved from Midcoast Maine to Western NY, where there is a larger and more active covid-conscious community – because the economy was so unstable, it took months to sell our house in Maine, but we did finally succeed, the day before Christmas
We joined the mask bloc here for a D&D night and had a lot of fun – looking forward to getting involved in mask distribution and attending more events in 2026
I finally read all of the Murderbot Diaries series by Martha Wells, spurred on by the release of the TV show – then I listened to the audiobooks, and it became my comfort listen for the whole latter part of the year
I ran an accessible birding event here in Rochester, and I’m hoping to run more next year
I took American Sign Language 101 and 102, which I’ve really enjoyed. I’ll be retaking 102 in early 2026 (it was a rough autumn/winter), and then I hope to move on to 103 and 104.
I learned to darn (as in, mending damaged knitted items), and I’m working on expanding my mending skills repertoire – this is well-timed, since, besides his own feathers and our hair, Tutu loves to bite on shirts until they have holes in them
We saw the most vivid aurora we’ve ever seen, including during our time in Alaska
My aunt sent me her scone recipe, and I made so. many. scones. this year
Bird Buddies! (Outdoor birds captured with our feeder cameras.)
The three baby bluebirds in the video below brought us so much joy this spring! Here, they appear to have a little conference, to decide whether it’s time to fly away or not, before a starling shows up.
Bird Buddies who live indoors
Miscellaney!
Work, in no particular order
I ran the first part of a major, potentially multi-year LibGuides accessibility remediation project (“potentially” because there’s a task force considering how important LibGuides are to us and our patrons, and maybe we will shift focus away from them or have a single accessibility remediator or … something I haven’t thought of, who knows?)
I co-ran a task force focused on accessibility training for library staff
We survived a university-wide “Cybersecurity Alignment” (or the first part of one?)
I learned the developer side of Figma (kind of, I still find parts of it baffling)
I learned a ridiculous amount about authentication to electronic resources (which would be really satisfying if I didn’t keep running into things I still don’t know)
Coming up in 2026, an incomplete list
I’ll take more ASL classes
I’ll mend some things
I’ll ride my bike more, because there are more safe places to do so where I live!
I’m hoping to work through more herbal studies and practice more of those skills – it may become vital in the near future
There will be an IT “alignment” at work mid-year – it could mean anything from “nothing” to “now I report to Central IT (who doesn’t care about my MLIS and might actually consider it a negative) instead of the Library (who doesn’t require an MLIS for my position, but knows it’s a strength, and also my team is so good, I don’t want to lose them, OK, yes, I am very stressed about this possibility)”
Our landlord will be selling our house, something I think (hope) he didn’t realize he’d be doing when we started renting here – we’ll get first right of refusal on buying it, and he’s willing to write us a lease for as long as we want one if we choose not to buy (NY law means the new owner will have to honor it), so while it’s a stressful situation, it’s not as bad as it could be
A valued colleague (everyone in my department is valued, truly, but his institutional knowledge is unmatched) will be retiring, and because of budget constraints, that will probably mean some shuffling of responsibilities semi-permanently
If we decide we aren’t moving (so, we decide to buy this house or to sign a longer lease), I’ll set up some garden beds and grow some things
I want this to be a thing, but financially, it may not: I really very much want to build or buy a small (like, Class B, or C at the highest) camper so that I can travel again
Ninety-five (or 100) years is a very long time for copyrights to last. But Olaf Stapledon saw a much longer future for us in Last and First Men (reviewed here and here). His book tells a story of successive human species over the next 2 billion years.
In January 2021, I began a journey that would span nearly five years, three children, countless late nights, and a singular focus: teaching machines to extract data from complex scientific tables with confidence—and to know when they're uncertain. On October 29, 2025, I successfully defended my dissertation titled "SCITEUQ: Toward Uncertainty-Aware Complex Scientific Table Data Extraction and Understanding" at Old Dominion University. This milestone represents not just the culmination of intensive research but a testament to perseverance, family support, and the power of focused determination.
Scientific tables are ubiquitous in research papers, containing critical experimental data, statistical results, and research findings. Yet extracting this data automatically from PDF documents remains surprisingly difficult. Unlike the simple, well-structured tables you might see on Wikipedia, scientific tables are complex beasts—featuring multi-level headers, merged cells, irregular layouts, and domain-specific notations that confound even state-of-the-art machine learning models.
But here's the real problem: existing methods don't tell you when they're wrong. They extract data with the same confidence whether they're processing a simple table or struggling with a complex one. For scientific applications where accuracy is paramount, this means researchers must manually verify every single extracted cell—a task that doesn't scale when you're dealing with thousands of tables.
The Research Challenge
My research addressed a fundamental question: How can we build systems that not only extract data from complex scientific tables but also quantify their uncertainty, allowing us to focus human verification effort only where it's needed?
To tackle this challenge, I formulated four research questions:
RQ1: What is the status of reproducibility and replicability of existing TSR models?
Before building something new, I needed to understand what already existed. I conducted the first systematic reproducibility and replicability study of 16 state-of-the-art Table Structure Recognition (TSR) methods. The results were sobering: only 8 of 16 papers made their code and data publicly available, and merely 5 had executable code. When I tested these methods on my newly created GenTSR dataset (386 tables from six scientific domains), none of the methods replicated their original performance. This highlighted a critical gap in the field. This work was published at ICDAR 2023: "A Study on Reproducibility and Replicability of Table Structure Recognition Methods."
RQ2: How do we quantify the uncertainties of TSR results?
To address this, I developed TTA-m, a novel uncertainty quantification pipeline that adapts Test-Time Augmentation specifically for TSR. Unlike vanilla TTA, my approach fine-tunes pre-trained models on augmented table images and employs ensemble-based methods to generate cell-level confidence scores. On the GenTSR dataset, TTA-m achieved an F1-score of 0.798, with over 80% accuracy for high-confidence predictions—enabling reliable automatic detection of extraction errors. This work was published at IEEE IRI 2024: "Uncertainty Quantification in Table Structure Recognition."
RQ3: How can we integrate uncertainties from TSR and OCR for holistic table data extraction?
I designed and implemented the TSR-OCR-UQ framework, which integrates table structure recognition (using TATR), optical character recognition (using PaddleOCR), and conformal prediction-based uncertainty quantification into a unified pipeline. The results were compelling: the accuracy improved from 53-71% to 83-97% for different complexity levels, with the system achieving 69% precision in flagging incorrect extractions and reducing manual verification labor by 53%. This work was published at ICDAR 2025: "Uncertainty-Aware Complex Scientific Table Data Extraction."
RQ4: How well do LLMs answer questions about complex scientific tables?
To evaluate the QA capability of Large Language Models on scientific tables, I created SciTableQA, a benchmark dataset containing 8,700 question-answer pairs across 320 complex scientific tables from multiple domains. My evaluation revealed that while GPT-3.5 achieved 79% accuracy on cell selection TableQA tasks, performance dropped to 49% on arithmetic reasoning TableQA tasks—highlighting significant limitations of current LLMs when dealing with complex table structures and numerical reasoning. This work was published at TPDL 2025: "SciTableQA: A Question-Answering Benchmark for Complex Scientific Tables."
The SCITEUQ Framework
Putting it all together, SCITEUQ (Scientific Table Extraction with Uncertainty Quantification) represents a comprehensive solution to uncertainty-aware scientific table data extraction. The framework achieves the state-of-the-art performance while providing essential uncertainty quantification capabilities that enable efficient human-in-the-loop verification.
Each component contributes to a more reliable approach:
Each of these papers faced initial rejection before ultimately being accepted. This taught me an invaluable lesson: rejection is not failure; it's an opportunity to refine and improve your work.
Industry Experience: From Azure to Alexa to Microsoft AI
While my research focused on scientific tables, my internships at Microsoft and Amazon broadened my perspective on applying machine learning at scale.
Microsoft (Summers 2022, 2023, 2025)
My first two summers at Microsoft were with the Azure team, where I worked on infrastructure optimization problems far from my research area. I developed an AI-human hybrid LLM-based multi-agent system for AKS Cluster configuration, reducing cluster type generation time from 2 weeks to 1 hour (link to blog post). I also designed ML anomaly detection systems on Azure Synapse that reduced hardware maintenance costs by over 20% and formulated new metrics for characterizing node interruption rates that decreased hardware downtime by 25% (link to blog post).
In Summer 2025, I joined the Microsoft AI team under the Bing organization, working on problems at the intersection of large-scale search and AI—which is what I'll be doing when I return to Microsoft full-time in January 2026.
Amazon (Summer 2024)
At Amazon, I worked with the Alexa Certification Technology team in California, where I drove 10% customer growth by designing LLM-based RAG systems with advanced prompt engineering techniques and increased the revenue by over 5% by developing LLM Agents on AWS to improve Alexa-enabled applications (link to blog post).
These internships, while not directly related to my dissertation research, taught me how to apply ML thinking to diverse industrial problems and to work effectively in large, complex organizations.
Balancing PhD Life with Family
Perhaps the most challenging aspect of my PhD journey had nothing to do with research—it was combining my studies with raising three young children. My youngest son, Daniel, was born just six month after I was enrolled in the PhD program. Managing research deadlines, experimental runs, paper submissions, and the demands of parenting three boys (Paul, David, and Daniel) required discipline and sacrifice.
I developed a strict routine: work from 9 AM to 3 PM every day at my research lab, then pick up my kids from school and be fully present for them. This meant no late nights in the lab, no weekend marathons of coding—just consistent, focused work during designated hours. It wasn't always easy. Conference deadlines sometimes meant asking my wife, Olabisi, to take on even more, or my mother, Beatrice, to provide extra support. But this routine kept me grounded and taught me that quality of work matters more than quantity of hours.
The Defense
On October 27, 2025, I defended my dissertation before my committee:
Dr. Yi He (Co-advisor) - College of William & Mary
Their thoughtful feedback, probing questions, and constructive critiques throughout my PhD journey were instrumental in refining my research and pushing me to think deeper about the implications and limitations of my work.
Lessons Learned
Looking back on nearly five years of doctoral work, several lessons stand out:
1. Embrace Rejection as Refinement
Four of my papers were initially rejected. Each rejection stung, but each one ultimately led to a stronger paper. The review process, while sometimes frustrating, forced me to clarify my arguments, strengthen my experiments, and address weaknesses I hadn't noticed. My TPDL 2025 paper on SciTableQA went through two rounds of revisions, but the final version is significantly better than the original submission.
2. Establish Non-Negotiable Boundaries
My 9 AM to 3 PM schedule wasn't just convenient—it was essential for maintaining my sanity and my family relationships. While some might argue that PhD students need to work 80-hour weeks, I proved that focused, disciplined work during reasonable hours can produce quality research. Those boundaries also made me more efficient: when you only have six hours a day, you learn to prioritize ruthlessly.
3. Build for Reproducibility from Day One
My systematic study on TSR reproducibility taught me the hard way how difficult it is to reproduce other people's work. This experience shaped how I approached my own research. Every framework I built—TTA-m, TSR-OCR-UQ, SciTableQA—comes with comprehensive documentation, publicly available code, and clear instructions for replication. Future researchers shouldn't struggle to build upon my work the way I struggled with others'.
4. Choose Problems That Matter to You
I entered my PhD knowing I wanted to work on table extraction with uncertainty quantification, and I never wavered from that focus. This singular vision helped me navigate the inevitable setbacks and distractions that come with doctoral research. When experiments failed or papers got rejected, I could always return to the core question: How do we make scientific data extraction both accurate and trustworthy?
5. Internships Broaden Your Perspective
While my Microsoft and Amazon internships didn't directly contribute to my dissertation, they fundamentally shaped how I think about research. Working on production systems with millions of users taught me to think about scalability, robustness, and real-world constraints in ways that academic research rarely emphasizes. These experiences make me a better researcher because I can now evaluate my work not just on benchmark performance, but on whether it could actually be deployed at scale.
Looking Forward
In January 2026, I'll be joining Microsoft as a Data Scientist 2 with the Microsoft AI team at the Redmond campus in Washington state. My family and I are excited about this new chapter—moving from Norfolk, Virginia, to the Pacific Northwest, and transitioning from academic research to industry applications.
While I'll be working on different problems at Microsoft, the skills and mindset I developed during my PhD—rigorous experimentation, systematic evaluation, uncertainty quantification, and reproducible research—will continue to guide my work. I'm particularly excited about the opportunity to apply research-driven thinking to real-world problems at a scale that can impact millions of users.
Acknowledgments
This journey would have been impossible without extraordinary support:
To Dr. Jian Wu, my advisor, mentor, and guide—thank you for believing in my research vision, for pushing me to think bigger, and for your patience during the inevitable frustrations of doctoral research. Your mentorship has not only shaped my research but also my approach to solving complex problems.
To Dr. Yi He, my co-advisor at William & Mary, your expertise and thoughtful feedback greatly enriched this research. Thank you for your guidance and support throughout this journey.
To my dissertation committee—Drs. Michael Nelson, Michele Weigle, and Sampath Jayarathna—your constructive critiques and expert insights were essential in refining my ideas and strengthening this work.
To my colleagues in WSDL and LAMP-SYS, the collaborative environment, intellectual exchanges, and camaraderie made this journey both enriching and memorable.
To my wife, Olabisi—you walked beside me every step of this journey with unwavering devotion and love. Your patience during the long hours, your understanding through the challenges, and your constant encouragement when the path seemed difficult made this achievement possible. This accomplishment is as much yours as it is mine.
To my sons—Paul, David, and Daniel—you are my greatest blessings and my constant source of joy and motivation. I hope this work serves as an example that with dedication and faith, you too can achieve your dreams.
To God Almighty, who is the source of all wisdom and strength, I give thanks and praise.


 This post was written by Noah Garcia, who attended the 2025 DLF Forum as a Student Fellow. The views and opinions expressed in this blog post are solely those of the author and do not necessarily reflect the official policy or position of the Digital Library Federation or CLIR. 2025 Student Fellowships were supported by a grant from MetaArchive.

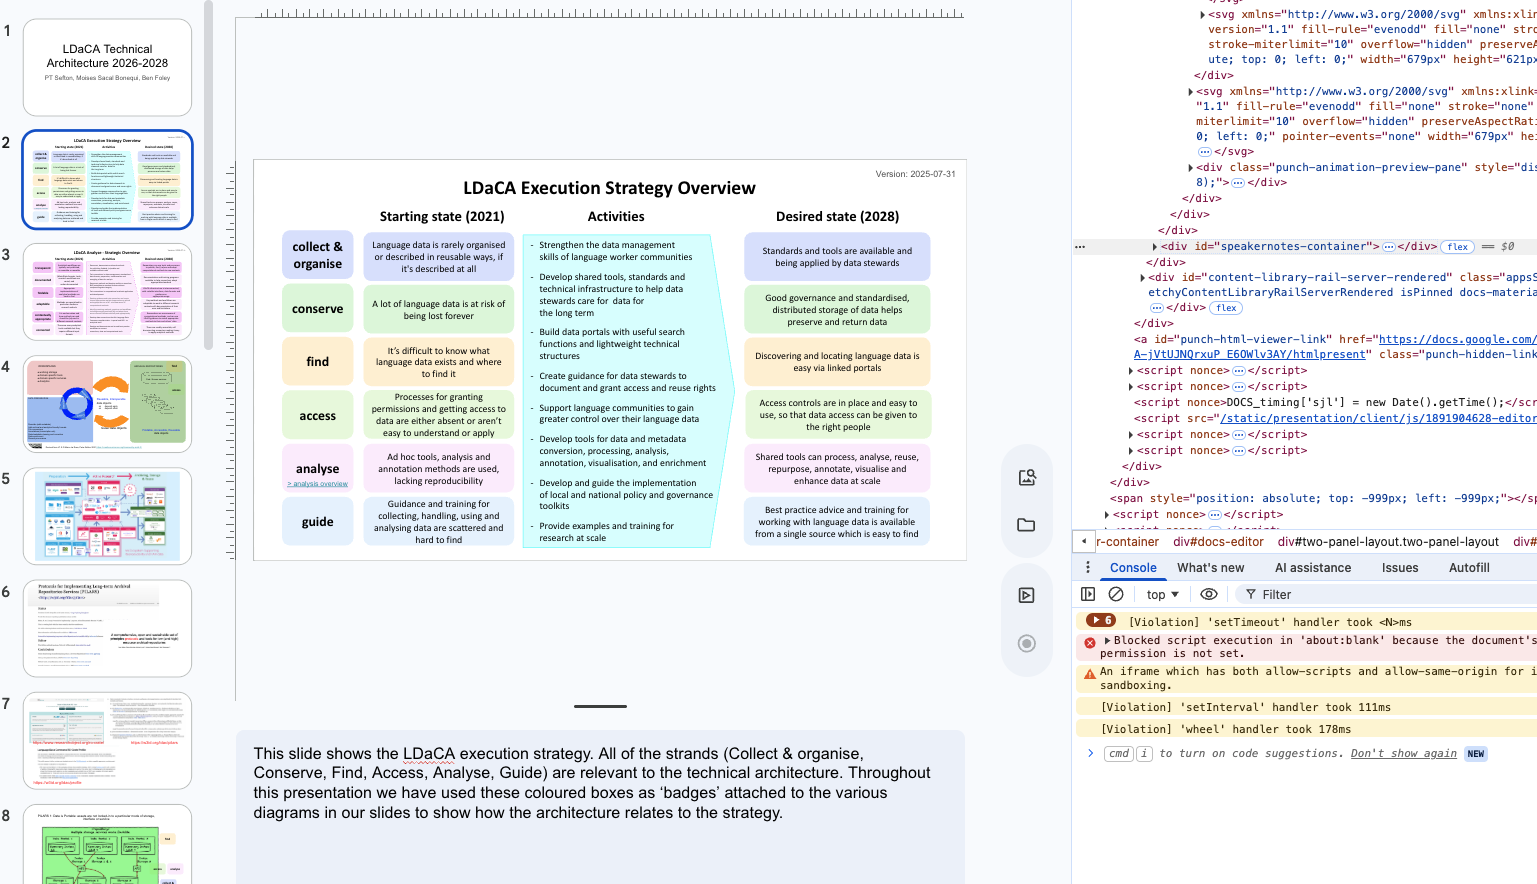
 ︎
︎


 This post was written by Hassna Ramadan, who attended the 2025 DLF Forum as the HBCU Students and Workers Fellow. The views and opinions expressed in this blog post are solely those of the author and do not necessarily reflect the official policy or position of the Digital Library Federation or CLIR.


 This post was written by Emily Woehrle, who attended the 2025 DLF Forum as an Emerging Professionals Fellow. The views and opinions expressed in this blog post are solely those of the author and do not necessarily reflect the official policy or position of the Digital Library Federation or CLIR. 2025 Emerging Professionals Fellowships were supported by a grant from MetaArchive.

 This post was written by Dorian McIntush, who attended the 2025 DLF Forum as an Emerging Professionals Fellow. The views and opinions expressed in this blog post are solely those of the author and do not necessarily reflect the official policy or position of the Digital Library Federation or CLIR. 2025 Emerging Professionals Fellowships were supported by a grant from MetaArchive.

 ︎
︎
 This post was written by Cláudia De Souza, who attended the 2025 DLF Forum as the Grassroots Archives and Cultural Heritage Workers Fellow. The views and opinions expressed in this blog post are solely those of the author and do not necessarily reflect the official policy or position of the Digital Library Federation or CLIR.
 This post was written by Amaobi Otiji, who attended the 2025 DLF Forum as a Student Fellow. The views and opinions expressed in this blog post are solely those of the author and do not necessarily reflect the official policy or position of the Digital Library Federation or CLIR. 2025 Student Fellowships were supported by a grant from MetaArchive.


