While working on the Saving Ads project, we identified problems with replaying ads (technical report: “Archiving and Replaying Current Web Advertisements: Challenges and Opportunities”) that used JavaScript code to dynamically generate URLs. These URLs included random values that differed during crawl time and replay time, resulting in failed requests upon replay. Figure 2 shows an example ad iframe URL that failed to replay, because a dynamically generated random value was used in the subdomain. URL matching approaches like fuzzy matching could resolve these problems by matching the dynamically generated URL with the URL that was crawled.
Goel, Zhu, Netravali, and Madhyastha’s "Jawa: Web Archival in the Era of JavaScript" involved identifying sources of non-determinism that cause replay problems when dynamically loading resources, removing some of the non-deterministic JavaScript code, and appling URL matching algorithms to reduce the number of failed requests that occur during replay.
Video 1: Presentation video
Sources of Non-Determinism
Non-determinism can cause variance in dynamically generated URLs (e.g., the same resource referenced by multiple URLs with different query string values, such as https://www.example.com/?rnd=4734 and https://www.example.com/?rnd=7765). This variance can result in failed requests (like the example shown in Figure 2) if the replay system does not have an approach for matching the requested URL with one that was successfully crawled. The sources of non-determinism that cause problems with replaying archived web pages are server-side state, client-side state, client characteristics, and JavaScript's Date, Random, and Performance (DRP) APIs. When replaying web pages client browsers do not maintain server-side and client-side state. The other sources of non-determinism (client characteristics and DRP APIs) are present during replay and impact JavaScript execution.
When a web page’s functionality requires dynamically constructed server responses (e.g., posting comments, push notifications, and login), the functionality can be impacted if the web page requires communication with a website’s origin servers. When an archived web page is loaded, the functionality would also be impacted if more resources were requested that were not archived during the crawling session. For client characteristics and DRP APIs, the authors ensured that all APIs would return the same value during replay time as they did during crawl time. For DRP APIs, they also used server-side matching of requested URLs to crawled URLs.
Reducing Storage When Archiving Web Pages
Goel et al. created a web crawler named Jawa (JavaScript-aware web archive) that removes non-deterministic JavaScript code so that the replay of an archived web page does not change if different users replay it. Since Jawa removes some third party scripts, the preservation style is in-between Archival Caricaturization and the Wayback style. Archival Caricaturization is a term created by Berlin et al. (“To Re-experience the Web: A Framework for the Transformation and Replay of Archived Web Pages”) to describe a type of preservation that does not preserve the web page as it originally was during crawl time. Archive.today is an example of Archival Caricaturization where all the original JavaScript is removed during replay. In contrast, archives that use the Wayback style archive and replay all of the resources of a web page and only make minimal rewrites during replay.
Jawa reduced the storage necessary for their corpus of 1 million archived web pages by 41% when compared to techniques that were used by Internet Archive during 2020 (Figure 3). This storage savings occurred because they discarded 84% of JavaScript bytes (Figure 4). During their presentation (https://youtu.be/WdxWpGJ-gUs?t=877), the authors mentioned that the 41% reduction in storage also includes other resources (e.g., HTML, CSS, and images) that would have been loaded by the excluded JavaScript code. Jawa saves storage by not archiving non-functional JavaScript code and removing unreachable code. When removing JavaScript code, they ensured that the removed code does not affect the execution of the rest of the code.
Brunelle et al.’s “Archival Crawlers and JavaScript: Discover More Stuff but Crawl More Slowly” also involved measuring JavaScript’s impact on storage when archiving web pages. They found that using a browser-based crawler that executes JavaScript during the crawling session resulted in 11.3 times more storage for all 303 web pages in their collection and 5.12 times more storage per URI (approximately 413.2 KB/URI). If we take this KB per URI measurement and multiply it with the number of URIs in Jawa’s corpus of 1 million web pages, it is expected for browser-based crawlers to require approximately 413.2 GB of storage to archive all web pages. When Goel et al. used techniques similar to the Internet Archive (which the authors referred to as IA*), it required 535 GB to archive the web pages in the corpus, while 314 GB of storage was required for Jawa. Since the amount of JavaScript (and the resources dynamically loaded by this code) has increased (Figure 5), the IA* approach required more storage than previously expected by Brunelle et al. Even though the amount of storage required to archive web pages has increased, Jawa achieved enough storage savings to go below the previously expected storage for browser-based crawlers.
Brunelle et al. also compared the crawl throughput and showed that using browser-based crawlers significantly increased the amount of time (38.9 times longer than using Heritrix) it takes to crawl web pages when compared to traditional web archive crawlers that do not execute the JavaScript during crawl time. Since Jawa can reduce the amount of JavaScript archived, it was able to improve the crawling throughput by 39% when it archived web pages from Goel et al.’s corpus (Figure 6).
Removing Non-Functional Code From JavaScript Files
Their approach for removing non-functional code is based on two observations about JavaScript code that will not work on archived web pages and relies on interacting with origin servers:
Most non-functional JavaScript code is compartmentalized in a few files and is not included in all JavaScript files.
The execution of third-party scripts will not work when replaying archived web pages.
To identify non-functional JavaScript, they created filter lists, instead of using complex code analysis. Their filter lists contain rules that were created based on manual analysis of the scripts from their corpus.
Every rule was based on domain, file name, or URL token:
For domain rules, they removed some URLs associated with a third party service.
For file name rules, they would identify files like “jquery.cookie.js” (which is used for cookie management) from any domain and not archive it.
For URL token rules, if a key word such as “recaptcha” was found in the URL they would not archive the resource.
The filter lists can be used to exclude URLs during crawl time to remove JavaScript files that are not needed. They removed third-party scripts that would not prevent post-load interactions from working during replay time. They also removed scripts that were on EasyList, which is an ad blocking filter list.
They checked if the code removed by Jawa visually or functionally impacted the replay of archived web pages. For visual impact, they checked if the archived web page looks the same with or without filtering by comparing screenshots of a web page archived by Jawa with filtering and without filtering. They then viewed the web pages that had different pixel values and only insignificant differences occurred like different time stamp information on the web page and different animations due to JavaScript’s Date, Random, and Performance (DRP) APIs.
For functional impact, they checked if the post-load interactions will work on the archived web page. They found that removing the files that matched their filter lists did not negatively impact the navigational and informational interactions.
Garg et al. (“Caching HTTP 404 Responses Eliminates Unnecessary Archival Replay Requests”) identified cases where archived web pages that require regular updates (e.g., news updates, new tweets, and sport scores updates) would repeatedly make failed requests to an origin server during replay time, which resulted in unnecessary traffic. Jawa could resolve this problem, because it removes code that communicates with an origin server, and this should reduce the amount of failed requests that can occur during replay for these types of archived web pages.
Removing Unreachable Code
For this approach, the code they removed is unreachable code that will never be executed. This unreachable code is associated with sources of non-determinism that are absent during replay time and sources of non-determinism caused by asynchronous execution and APIs for client characteristics.
The code that is executed when an event handler is invoked can differ depending on the order the user interacts with elements on the page (Figure 7), the inputs the user provides to the events, and the values returned by the browser’s APIs:
Order of user interaction: They focused on read-write dependency and found that the event handlers would not impact the replay since these events were used for user analytics that would track user interaction.
User input: None of the event handlers that work at replay time would read inputs that impact which code gets executed.
Browser APIs: Jawa removes APIs for client characteristics so only DRP APIs would be executed during replay time. When they checked the web pages in their corpus, the DRP APIs did not impact the reachable code for any event handler.
For the resources not filtered out by their filter lists, Jawa injects code (Figure 8) to identify which code was executed and in what order and then triggers every registered event handler using default input values and identifies which code was executed. The code that was executed gets stored. They then ensure that the browser will follow the same execution schedule and use the same client characteristics.
Utilizing URL Matching Algorithms to Handle Non-Determinism
When non-determinism causes variance in web resources’ URLs it results in failed requests, which prevents the web resources from loading. To mitigate this replay problem, Jawa uses approximate URL matching at the backend and intercepts calls to DRP APIs, supplying the return value of the API that was previously saved during crawl time. Goel et al. used two URL matching algorithms, querystrip and fuzzy matching, to match the requested URL with a crawled URL.
Querystrip removes the query string from a URL before initiating a match. This approach can help with cases where the query string is updated for a resource based on the server-side state. Figures 9 and 10 show an example where querystrip would be useful. We identified a replay problem (that resulted in a failed request for most replay systems except for ReplayWeb.page) with Amazon ad iframes that used a random value in the query string. If the query string is removed from this URL and a search is performed for the base URL in the WACZ file, then we could match the URL that was dynamically generated during replay with the URL that was crawled.
Figure 9: Example URI for an Amazon ad iframe. The rnd parameter in the query string contains a random value that is dynamically generated when loading an ad.
Figure 10: When replaying an Amazon ad iframe, the rnd parameter is not the same as the original value that is in the URI-R. Even though an incorrect URI-M is generated, ReplayWeb.page is able to load the ad. WACZ | URI-R: https://aax-us-east.amazon-adsystem.com/e/dtb/admi?b=...
Goel et al.’s fuzzy matching approach used Levenshtein distance to find the best match for a URL. An example of fuzzy matching for a replay system is pywb’s rules.yaml and pywb’s fuzzymatcher.py script that uses these rules. According to their presentation (https://youtu.be/WdxWpGJ-gUs?t=931), Jawa eliminated failed network fetches on around 95% of the pages from their corpus of 3,000 web pages (Figure 11). Their paper reported 99% of eliminated failed network fetches, but it is listed as 95% in the more recent slides.
This group’s continued work (“Detecting and Diagnosing Errors in Replaying Archived Web Pages”) involves identifying URL rewriting problems caused by JavaScript that impacts the quality of the archived web page during replay. Their goal is to create a new approach for verifying the quality of an archived web page that is better than comparing screenshots and viewing failed requests. Their approach involves capturing (during crawl and replay time) each visible element in the DOM tree, the location and dimensions of the elements, and the JavaScript that produces visible effects. Their approach was able to reduce false positives while detecting low fidelity during replay when compared to using only screenshots and runtime and fetch errors.
Summary
Goel et al. created a web crawler named Jawa (JavaScript-aware web archive) that removes some non-deterministic JavaScript code so that the replay of an archived web page does not change if different users replay it. Their crawler also reduces the amount of storage needed when archiving web pages by removing non-functional and unreachable JavaScript code.
The sources of non-determinism that cause problems with replaying archived web pages are server-side state, client side state, client characteristics, and JavaScript's Date, Random, and Performance APIs. When non-determinism caused variance in a dynamically generated URL during replay, they used two URL matching algorithms which are querystrip and fuzzy matching to match the requested URL with a crawled URL. These URL matching algorithms can reduce the number of failed requests and could resolve replay problems associated with random values in dynamically generated URLs, which is a problem we encountered during the Saving Ads project while replaying ads.
Win free books from the July 2025 batch of Early Reviewer titles! We’ve got 191 books this month, and a grand total of 3,477 copies to give out. Which books are you hoping to snag this month? Come tell us on Talk.
The deadline to request a copy is Friday, July 25th at 6PM EDT.
Eligibility: Publishers do things country-by-country. This month we have publishers who can send books to the US, the UK, Canada, Germany, Australia, Greece, Cyprus, Czechia, Spain, Denmark and more. Make sure to check the message on each book to see if it can be sent to your country.
Thanks to all the publishers participating this month!
How to tell if someone's bullshitting: watch for them to give a deadline that they repeatedly push back.
This was apropos of Donald Trump's approach to tariffs and Ukraine, but below the fold I apply the criterion to Elon Musk basing Tesla's future on its robotaxi service.
Jonathan V. Last's A Song of “Full Self-Driving”: Elon Isn’t Tony Stark. He’s Michael Scott. shows that Musk's bullshitting started almost a decade ago:
For years, Elon Musk has been promising that Teslas will operate completely autonomously in “Full Self Driving” (FSD) mode. And when I say years, I mean years:
December 2015: “We’re going to end up with complete autonomy, and I think we will have complete autonomy in approximately two years.”
January 2016: “In ~2 years, summon should work anywhere connected by land & not blocked by borders, eg you’re in LA and the car is in NY.”
June 2016: “I really would consider autonomous driving to be basically a solved problem. . . . I think we’re basically less than two years away from complete autonomy, complete—safer than a human. However regulators will take at least another year.”
October 2016: By the end of 2017 Tesla will demonstrate a fully autonomous drive from “a home in L.A., to Times Square . . . without the need for a single touch, including the charging.”
March 2018: “I think probably by end of next year [end of 2019] self-driving will encompass essentially all modes of driving”
February 2019: “I think we will be feature complete—full self-driving—this year. Meaning the car will be able to find you in a parking lot, pick you up, take you all the way to your destination without an intervention, this year."
@motherfrunker" tracks this BS, and the most recent entry is:
January 2022: I will be shocked if we don't achieve FSD safer than a human this year
But finally, on June 22nd, Tesla's robotaxi revolution arrived. Never one to miss an opportunity to pump the stock with bullshit, Musk:
envisions a future fleet, including a new “Cybercab” and “Robovan” with no steering wheels or pedals, that could boost Tesla’s market value by an astonishing $5 trillion to $10 trillion. On June 20, Tesla was worth $1.04 trillion
“My view is the golden age of autonomous vehicles starting on Sunday in Austin for Tesla,” said Wedbush analyst Dan Ives. “I believe it’s a trillion dollar valuation opportunity for Tesla.”
Dan Ives obviously only sipped 10-20% of Musk's CoolAid. Others drank deeper:
Investor Cathie Wood’s ARK Invest predicts robotaxis could account for 90% of Tesla’s profits by 2029. If they are right, this weekend’s launch was existential.
Tesla's net income from the trailing 12 months is around $6.1B and falling. Assuming, optimistically, that they can continue to sell cars at the current rate, Cathie Woods is assuming that robotaxi profits would be around $60B. Tesla's net margin is around 6%, so this implies revenue of almost $1T in 2029. Tesla charges $4.20/ride (ha! ha!), so this implies that they are delivering 231B rides/year, or around 23,000 times the rate of the entire robotaxi industry currently. Woods is projecting that in four year's time Tesla's robotaxi business will have almost as much revenue as Amazon ($638B), Microsoft ($245B) and Nvidia ($130B) combined.
"On generous assumptions, Tesla’s core EV business, generating 75% of gross profit but with falling sales, might be worth roughly $50 per share, only 15% of the current price. Much of the remainder relates to expectations around self driving. RBC Capital, for example, ascribes 59% of its price target, or $181 per share, to robotaxis and a further $53 to monetizing Full Self Driving technology. Combined, that is a cool $815 billion based on double-digit multiples ascribed to modeled revenue — not earnings — 10 to 15 years from now because, after all, it relates to businesses that barely make money today."
Tesla’s much-anticipated June 22 “no one in the vehicle” “unsupervised” Robotaxi launch in Austin is not ready. Instead, Tesla is operating a limited service with Tesla employees on board the vehicle to maintain safety.
...
Having an employee who can intervene on board, commonly called a safety driver, is the approach that every robocar company has used for testing, including testing of passenger operations. Most companies spend many years (Waymo spent a decade) testing with safety drivers, and once they are ready to take passengers, there are typically some number of years testing in that mode, though the path to removing the safety driver depends primarily on evaluation of the safety case for the vehicle, and less on the presence of passengers.
In addition to Musk’s statements about the vehicle being unsupervised, with nobody inside, in general the removal of the safety driver is the biggest milestone in development of a true robotaxi, not an incremental step that can be ignored. As such, Tesla has yet to meet its goals.
Seven-and-a-half years after Musk's deadline for "complete autonomy" the best Tesla can do is a small robotaxi service for invited guests in a geofenced area of Austin with a safety driver in daylight. Waymo has 100 robotaxis in service in Austin. Three months ago Brad Templeton reported that:
Waymo, the self-driving unit of Alphabet, announced recently that they are now providing 200,000 self-driving taxi rides every week with no safety driver in the car, only passengers.
...
In China, though, several companies are giving rides with no safety driver. The dominant player is Baidu Apollo, which reports they did 1.1 million rides last quarter, which is 84,000 per week, and they now are all no-safety-driver. Pony.AI claims 26,000 per week, but it is not clear if all are with no safety driver. AutoX does not report numbers, but says it has 1,000 cars in operation. WeRide also does not report numbers.
US auto safety regulators are looking into incidents where Tesla Inc.’s self-driving robotaxis appeared to violate traffic laws during the company’s first day offering paid rides in Austin.
...
In one video taken by investor Rob Maurer, who used to host a Tesla podcast, a Model Y he’s riding in enters an Austin intersection in a left-turn-only lane. The Tesla hesitates to make the turn, swerves right and proceeds into an unoccupied lane meant for traffic moving in the opposite direction.
A honking horn can be heard as the Tesla re-enters the correct lane over a double-yellow line, which drivers aren’t supposed to cross.
In two other posts on X, initial riders in driverless Model Ys shared footage of Teslas speeding. A vehicle carrying Sawyer Merritt, a Tesla investor, reached 35 miles per hour shortly after passing a 30 miles per hour speed limit sign, a video he posted shows.
But immediately after that rollout, Tesla drivers started racking up fines for violating the law. Many roads in China are watched by CCTV cameras, and fines are automatically handed out to drivers to break the law.
It’s clear that the system still needs more knowledge about Chinese roads in general, because it kept mistaking bike lanes for right turn lanes, etc. One driver racked up 7 tickets within the span of a single drive after driving through bike lanes and crossing over solid lines. If a driver gets enough points on their license, they could even have their license suspended.
Why did Tesla roll out their $8K "Intelligent Assisted Driving" in China? It might have something to do with this:
There are already many competing robotaxi services in China. For example:
Baidu is already operating robotaxi services in multiple cities in China. It provided close to 900,000 rides in the second quarter of the year, up 26 per cent year-on-year, according to its latest earnings call. More than 7 million robotaxi rides in total had been operated as of late July.
That was a year ago. It isn't just Waymo that is in a whole different robotaxi league than Tesla. And lets not talk about the fact that BYD, Xiaomi and others outsell Tesla in China because their products are better and cheaper. Tesla's response? Getting the White House to put a 25% tariff on imported cars.
Happy July, DLF Community! We hope you’re having a pleasant summer so far and that you’re staying cool however you can. Between vacations and time to relax, we hope to catch you at a DLF Working Group meeting sometime this month. And, because the fall will be here before we know it, we hope you’re making plans to come to the Forum and Learn@DLF this November – registration is open and all programs have been released for what’s sure to be a wonderful week in colorful Colorado.
See you soon!
— Aliya from Team DLF
This month’s news:
Forum program announced, registration open: The program for the 2025 DLF Forum is now available. Register at the earlybird rate to join us in Denver in November.
Opportunity: H-NET Spaces invites applications for its Spaces Cohort Program, which supports early-stage projects and/or scholars in need of support and hands-on training in DH methods. Applications due July 1.
Call for climate-conscious bookworms: DLF’s Climate Justice Working Group summer book group is meeting Tuesday, July 29 at 1pm ET. They’ll be discussing chapters 5&6 of After Disruption: A Future for Cultural Memory by Trevor Owens, which is available open access. All are welcome to join, even if you’re not a regular participant in the working group and/or missed the first discussions. Register here to join.
Office closure: CLIR offices will be closed July 3-4 in observance of Independence Day.
This month’s open DLF group meetings:
For the most up-to-date schedule of DLF group meetings and events (plus NDSA meetings, conferences, and more), bookmark the DLF Community Calendar. Meeting dates are subject to change. Can’t find the meeting call-in information? Email us at info@diglib.org. Reminder: Team DLF working days are Monday through Thursday.
DLF Born-Digital Access Working Group (BDAWG): Tuesday, 7/1, 2pm ET / 11am PT
DLF Digital Accessibility Working Group (DAWG): Tuesday, 7/1, 2pm ET / 11am PT
DLF AIG Cultural Assessment Working Group: Monday, 7/14, 1:00pm ET /10am PT
DLF AIG Metadata Assessment Working Group: Thursday, 7/17, 1:15pm ET / 10:15am PT
DLF AIG User Experience Working Group: Friday, 7/18, 11am ET / 8am PT
DLF Digital Accessibility Policy & Workflows Subgroup: Friday, 7/25, 1pm ET / 10am PT
DLF Digital Accessibility Working Group IT & Development (DAWG-IT) Subgroup: Monday, 7/28, 1:15pm ET / 10:15am PT
Libraries play a crucial role in ensuring equitable access to information, yet many collected materials remain inaccessible to patrons with disabilities. How can resource-sharing practitioners leverage their expertise and systems to bridge this gap? This question was at the heart of a recent OCLC Research Library Partnership (RLP) Works in Progress Webinar, Increasing the accessibility of library materials—Roles for ILL, where experts from three large academic libraries shared their practices and insights for improving collection accessibility for users who need accommodations.
Accessibility has long been a topic of interest and action for the SHARES resource sharing consortium, and all three speakers were from SHARES institutions. As the consortium’s coordinator, I introduced the session by highlighting some of the group’s previous work on accessibility, which included surveying members about current practices, challenges, and aspirations around accessibility, creating a resource document on accessibility and ILL, and drafting accessibility provisions that were incorporated into the latest revision of the US Interlibrary Loan (ILL) code in 2023.
Next our three distinguished presenters took to the virtual stage:
Clara Fehrenbach, Document Delivery Services Librarian at the University of Chicago Library
Ronald Figueroa, Resource Sharing and Facility Manager at Syracuse University Libraries
Brynne Norton, Head of Resource Sharing & Reserves at the University of Maryland Libraries
Key takeaways
The session highlighted various models and strategies for enhancing accessibility in library collections. Here are key insights shared by the presenters:
Making procurement seamless for qualified patrons: Clara Fehrenbach discussed the University of Chicago’s partnership with Student Disability Services (SDS). This collaboration allows students to request alternate formats directly through the library catalog, ensuring privacy and streamlined access to necessary materials. The library scans materials that SDS can’t source elsewhere, while SDS evaluates and authorizes patron eligibility and does the actual document remediation.
Providing PDFs of hard-to-get material still in copyright: Brynne Norton outlined the Accessible Library Text Retrieval Program (ALTR) at the University of Maryland. This program provides text-searchable PDFs of in-copyright library materials for students with visual impairments and other disabilities, serving as a last resort when other accessible formats are unavailable. Accessibility and Disability Service (ADS) staff determine who qualifies for this service as an accommodation.
Offering multiple levels of remediation: Ronald Figueroa outlined Alternate Format Services (AFS) at Syracuse University, which provides alternate formats for items owned, licensed, or obtained via ILL for qualified patrons. Service eligibility is determined by the Center for Disability Resources for students and by the ADA Coordinator for faculty and staff. AFS remediates for magnification, text-to-speech, or screen readers, according to need, and outsources jobs over 200 pages.
Practical tips for ILL practitioners
The presenters shared practical advice for libraries looking to start offering accessibility services or enhance an existing service:
Start small: Begin with basic services and gradually expand capabilities based on available resources.
Understand patron needs: Tailor services to meet the specific needs of patrons, whether it’s OCR documents, accessible PDFs, or other formats.
Leverage partnerships: Collaborate with Disability Services Offices (DSOs) on campus to determine eligibility and streamline the provision of accessible materials.
Maintain communication: Keep in close touch with partners to ensure ongoing support and address any changes in staff or procedures.
They also offered guiding principles for those who might be feeling overwhelmed by the prospect of starting up a new accessibility service:
Let those who are already good at it do it: ILL = scanning; Student Disability Services = eligibility.
Don’t overpromise: Understand what you actually have the bandwidth to offer before partnering.
Don’t be shy: Know that Student Disability Services folks are eager to partner.
Tap into your ILL community: Ask your peers for help.
Looking ahead
The webinar also looked to the horizon for upcoming developments in accessibility, including the integration of Optical Character Recognition (OCR) into OCLC’s Article Exchange document delivery application and burgeoning efforts by the ALA RUSA STARS Codes and Guidelines Committee to establish scanning standards, with a focus on improving scanning for accessibility. These initiatives are crucial for ensuring that all patrons have equitable access to library resources.
This webinar provided valuable insights and practical strategies for improving accessibility in library collections. By leveraging collaborative efforts, specialized programs, and efficient workflows, libraries can make significant strides in ensuring that all patrons, regardless of their abilities, have access to the information they need. We invite you to learn more by watching the recorded webinar, and exploring the wealth of resources shared on the recording webpage.
The training, offered by Public Lab Mongolia, attracted the interests of Mongolian open data enthusiasts and practitioners from various fields, including sociology students and practitioners, data analysts, health researchers, university lecturers, civil society, and private sector professionals.
In onze blogpost uit 2023, “Machine Learning en WorldCat“, vertelden we voor het eerst hoe we machine learning inzetten om dubbele records in WorldCat op te sporen en samen te voegen.
Het verwijderen van dubbele records is altijd belangrijk voor de kwaliteit van WorldCat. Het maakt catalogiseren efficiënter en verbetert de algehele kwaliteit. Nu bibliografische gegevens sneller dan ooit binnenstromen, moeten we ervoor zorgen dat records nauwkeurig, samenhangend en toegankelijk blijven. En dat in hoog tempo.
Met AI kunnen we het ontdubbelen van gegevens snel en efficiënt opschalen. Toch blijft menselijke kennis en ervaring belangrijk voor het succes. Bij OCLC hebben we geïnvesteerd in een hybride aanpak: we gebruiken AI om enorme hoeveelheden data te verwerken, terwijl catalogiseerders en OCLC-experts de belangrijkste beslissingen blijven nemen.
Van papieren strookjes naar machine learning
Voordat ik bij OCLC kwam, werkte ik al aan het verbeteren van bibliografische gegevens. Het samenvoegen van dubbele records deden we toen nog helemaal handmatig. Bibliotheken stuurden ons papieren strookjes met mogelijke duplicaten, vaak voorzien van uitleg van een catalogiseerder.
We sorteerden duizenden strookjes in archiefkasten: groene strookjes voor boeken, blauwe voor niet-boeken en roze voor series. De hoeveelheid strookjes was zo groot dat we zelfs kantoormeubilair moesten gebruiken om ze op te slaan. Je kon uiteindelijk nergens meer een pen of notitieblok vinden.
Deze afbeelding is gemaakt met AI en geeft een indruk van hoe de rommelige gangen eruitzagen waar we de duplicaatstrookjes bewaarden. Het ziet er hier veel netter uit dan het in werkelijkheid was.
Als ik erop terugkijk, zie ik hoe vooruitziend die gezamenlijke inspanning was. Het was langzaam en methodisch werk, maar het liet zien hoe zorgvuldig we toen te werk gingen. Elk strookje stond voor een beslissing, een stukje menselijk oordeel dat bepaalde of records in ons systeem werden samengevoegd of behouden. Ondanks ons harde werk konden we het nooit helemaal bijhouden. De stapel duplicaten bleef groeien en we liepen altijd achter de feiten aan.
Het verschil met nu is enorm. Sinds ik bij OCLC werk met AI-gestuurde ontdubbeling, besef ik pas hoe veel efficiënter we dit tegenwoordig kunnen aanpakken. Wat vroeger jaren duurde, doen we nu in weken, met meer nauwkeurigheid en in meer talen, schriften en materiaaltypes dan ooit tevoren. Toch blijft de kern van het werk hetzelfde: menselijke expertise is onmisbaar. AI is geen wondermiddel. Het leert van onze catalogiseringsnormen, ons professionele oordeel en onze correcties.
Door een hybride aanpak te gebruiken, waarbij machine learning het zware werk doet en menselijke controle het proces stuurt en verfijnt, kunnen we een balans vinden tussen snelheid en precisie. Zo bouwen we voort op het beste van beide werelden.
Innovatie en zorgvuldigheid in balans houden in WorldCat
Al tientallen jaren werken catalogiseerders, metadatabeheerders en OCLC-teams samen om de betrouwbaarheid van WorldCat te waarborgen. Zo blijft het een hoogwaardige, betrouwbare bron voor bibliotheken en onderzoekers. Het verwijderen van dubbele records is een belangrijk onderdeel van deze inspanning. Het zorgt ervoor dat alles overzichtelijker wordt, makkelijker doorzoekbaar is en beter uitwisselbaar is tussen verschillende systemen.
Met AI kunnen we dubbele records nu op een nieuwe manier aanpakken. Hierdoor kunnen we veel meer duplicaten opsporen en samenvoegen dan ooit tevoren. De belangrijkste uitdaging is om AI verantwoord en transparant toe te passen, zodat het aansluit bij professionele catalogiseringsnormen.
Deze schaalbare aanpak sluit naadloos aan bij onze langdurige rol als beheerders van gedeelde bibliografische gegevens. AI biedt ons de kans om menselijke expertise te versterken, zonder deze te vervangen.
Een nieuwe kijk op ontdubbeling
Tot nu toe gebruikten we vaste algoritmes en veel handwerk om dubbele records samen te voegen. Dit werkte wel, maar had duidelijke grenzen.
Met de AI-gestuurde ontdubbelingsmethoden van OCLC kunnen we nu veel meer bereiken:
Meer talen en schriften: Ons machine learning-algoritme verwerkt efficiënt niet-Latijnse schriften en records in allerlei talen. Hierdoor kunnen we sneller duplicaten opsporen in wereldwijde collecties.
Meer soorten records: AI herkent duplicaten in een breder scala aan bibliografische gegevens. Ook helpt het ons bij materiaaltypes die eerder lastig waren om te ontdubbelen.
Bescherming van zeldzame en speciale collecties: Bij zeldzame en unieke materialen zetten we geen AI in. Zo blijven bijzondere items in archieven en speciale collecties goed beschermd.
Dankzij deze verbeteringen kunnen we de metadata van WorldCat verder verbeteren, met aandacht voor meer materialen en talen. Dit stelt ons in staat om de kwaliteit van data verantwoord te verhogen.
Wat “verantwoorde AI” in de praktijk betekent
De term ‘AI’ is breed en roept bij sommigen scepsis op. Dat is begrijpelijk. Verschillende AI-toepassingen brengen vragen met zich mee over vooroordelen, nauwkeurigheid en betrouwbaarheid.
Onze aanpak is gebaseerd op een paar belangrijke principes:
AI als aanvulling op menselijke expertise: AI is bedoeld om mensen te ondersteunen, niet te vervangen. We hebben menselijke controle en het labelen van data ingebouwd, zodat onze AI-modellen leren volgens de beste catalogiseringspraktijken.
Efficiëntie zonder concessies aan kwaliteit: Onze AI is ontwikkeld om slim met computercapaciteit om te gaan, zonder dat dit ten koste gaat van de nauwkeurigheid en kwaliteit van de records.
Duurzaamheid: We zorgen ervoor dat onze systemen niet meer computerkracht gebruiken dan nodig. Zo blijven de resultaten goed, zonder verspilling. Door AI slim in te zetten, blijft ontdubbeling betaalbaar en toekomstbestendig, terwijl we blijven groeien.
Het doel is niet om mensen te vervangen, maar om hun kennis en tijd beter te benutten. Catalogiseerders kunnen zich daardoor richten op werk dat echt waarde toevoegt voor hun gebruikers, in plaats van eindeloos dubbele records op te ruimen.
Daarnaast spelen catalogiseerders en onze ervaren OCLC-medewerkers een actieve rol in dit proces. Door gegevens te labelen en feedback te geven, helpen zij AI steeds beter te worden in het herkennen en verwerken van duplicaten.
AI als gezamenlijke inspanning en de weg vooruit
Ik mis de stapels papieren strookjes en het elk kwartaal opruimen van archiefkasten niet, maar ik waardeer wel wat ze symboliseerden: zorgvuldigheid en toewijding. AI vervangt die zorgvuldigheid niet, maar bouwt erop voort en tilt het naar een hoger niveau.
Terwijl de tools zich blijven ontwikkelen, blijven onze principes hetzelfde. OCLC gebruikt al lange tijd technologie om bibliotheken te helpen bij het beheren van hun catalogi en collecties. Nu passen we diezelfde aanpak toe op AI: doelgericht, effectief en geworteld in onze gedeelde toewijding aan de kwaliteit van metadata.
Deze manier van innoveren stelt bibliotheken in staat om te voldoen aan veranderende behoeften en waarde te blijven leveren aan hun gebruikers.
Doe mee met OCLC’s datalabeling-initiatief en help de rol van AI bij het ontdubbelenverbeteren.
AI-gestuurde ontdubbeling is een gezamenlijke inspanning die voortdurend wordt verfijnd dankzij de input van de gemeenschap en professionele controle. Jouw bijdrage heeft direct invloed op de kwaliteit en efficiëntie van WorldCat. Daarmee komt het de hele bibliotheekgemeenschap ten goede.
En la entrada de blog de agosto de 2023 titulada “Machine Learning y WorldCat”, compartimos, por primera vez, nuestros esfuerzos para aprovechar el Aprendizaje Automático con el fin de mejorar la deduplicación en WorldCat.
La deduplicación siempre ha sido un elemento central para garantizar la calidad de WorldCat, ya que mejora la eficiencia y la calidad de la catalogación. Sin embargo, con el aumento acelerado de datos bibliográficos, nos enfrentamos al desafío de mantener los registros actualizados, conectados y accesibles de forma rápida. La deduplicación impulsada por la IA ofrece una forma innovadora de agilizar este trabajo de manera eficiente, pero su éxito sigue dependiendo del conocimiento y criterio humano. En OCLC, hemos apostado por un enfoque híbrido que combina la capacidad de la IA para manejar grandes volúmenes de datos con el papel esencial de los catalogadores y de los expertos de OCLC a la hora de tomar las decisiones clave.
De las fichas en papel al Aprendizaje Automático
Antes de unirme a OCLC, trabajé en el área de calidad de datos bibliográficos en una época en la que la deduplicación se realizaba de manera completamente manual. Como parte de un programa de mejora de calidad, las bibliotecas nos enviaban fichas de papel detallando posibles duplicados, cada una acompañada de la explicación del catalogador en cuestión. Recuerdo que clasificábamos miles de estas fichas por colores: verde para libros, azul para materiales no bibliográficos, rosa para publicaciones seriadas. Incluso reutilizamos archivadores de la oficina para almacenar las fichas de duplicados que se nos desbordaban: encontrar bolígrafos y blocs de notas era prácticamente imposible.
Esta imagen ha sido generada con IA para recrear mi recuerdo de los pasillos de archivadores abarrotados de fichas de duplicados. La IA lo ha recreado de manera más ordenada de lo que realmente era.
En retrospectiva, creo que fue un esfuerzo colaborativo con visión de futuro. Sin embargo, era un trabajo lento y meticuloso, que reflejaba la naturaleza minuciosa de nuestras tareas en aquel momento. Cada ficha representaba una decisión, un juicio humano que definía si los registros en nuestro sistema se fusionaban o permanecían separados. A pesar de todo el esfuerzo, este proceso estaba limitado por su volumen: siempre íbamos detrás de los duplicados en lugar de adelantarnos a ellos.
Hoy, trabajando en la deduplicación impulsada por la IA en OCLC, me sorprende lo mucho que hemos avanzado. Lo que antes requería años ahora se completa en semanas, con mayor precisión y abarcando más idiomas, escrituras y tipos de materiales que nunca. Sin embargo, el núcleo del trabajo sigue siendo el mismo: el conocimiento humano es fundamental. La IA no es una solución mágica; aprende de nuestros estándares de catalogación, de nuestro criterio profesional y de nuestras correcciones.
Al adoptar un enfoque híbrido para la deduplicación, podemos utilizar el Aprendizaje Automático para realizar el trabajo pesado mientras garantizamos que la supervisión humana guíe y refine el proceso.
Equilibrandola innovación y la responsabilidad en WorldCat
Durante décadas, catalogadores, especialistas en metadatos y equipos de OCLC han trabajado para mantener la integridad de WorldCat, asegurando que sea un recurso fiable y de alta calidad para bibliotecas e investigadores. La deduplicación siempre ha sido una pieza clave en este trabajo, eliminando registros duplicados para optimizar la eficiencia, facilitar el descubrimiento y mejorar la interoperabilidad.
Ahora, la IA nos permite abordar la eliminación de duplicados de nuevas maneras, ampliando drásticamente nuestra capacidad para identificar y fusionar registros duplicados a gran escala. Sin embargo, la verdadera cuestión no es solo cómo aplicar la IA, sino cómo hacerlo de manera responsable, transparente y en consonancia con los estándares profesionales de catalogación.
Este modelo para ampliar la eliminación de duplicados es una continuación de nuestra misión histórica de preservar y gestionar datos bibliográficos compartidos. La IA ofrece una oportunidad para potenciar el conocimiento humano, no para sustituirlo.
El giro fundamental en la deduplicación
Históricamente, la deduplicación se ha basado en algoritmos deterministas y en el esfuerzo manual de catalogadores y de los equipos de OCLC. Aunque estos métodos han sido efectivos, también presentan ciertas limitaciones.
Las técnicas de deduplicación impulsadas por IA que hemos desarrollado en OCLC nos permiten:
Ampliar el alcance más allá del inglés y las lenguas romances: Nuestro algoritmo de Aprendizaje Automático procesa con mayor precisión y eficiencia escrituras no latinas y registros en todos los idiomas, lo que mejora la deduplicación rápida en colecciones globales.
Abordar una mayor variedad de tipos de registros: La IA facilita la identificación de duplicados en un espectro más amplio de registros bibliográficos y aporta nuevos conocimientos sobre materiales más complejos de tratar.
Preservar colecciones raras y especiales: Actualmente no aplicamos procesos de deduplicación impulsados por IA a materiales raros, garantizando así la preservación de los registros únicos de archivos y colecciones especiales.
Estos avances permiten mejorar la precisión de los metadatos en una variedad más amplia de materiales e idiomas, lo que nos ayuda a ampliar el trabajo que realizamos para garantizar la calidad de los metadatos de WorldCat de manera responsable.
Qué significa “IA responsable” en la práctica
El concepto de “IA” es amplio y, con frecuencia, genera escepticismo. Y no es para menos: muchas aplicaciones de Inteligencia Artificial plantean preocupaciones relacionadas con sesgos, precisión y fiabilidad.
Nuestro enfoque se basa en algunas ideas clave:
La IA debe complementar el conocimiento humano, no reemplazarlo. Hemos integrado la revisión manual y el etiquetado de datos para garantizar que los modelos de IA se entrenen siguiendo las mejores prácticas de catalogación.
La eficiencia no debe comprometer la fiabilidad. La deduplicación impulsada por IA está diseñada para optimizar los recursos computacionales, asegurando que la automatización no afecte la calidad de los registros.
La sostenibilidad es fundamental. Hemos desarrollado un sistema eficiente desde el punto de vista computacional, que reduce el uso innecesario de recursos mientras mantiene resultados de alta calidad. Al optimizar la huella tecnológica de la IA, garantizamos que la deduplicación sea rentable y viable a largo plazo.
Este modelo de deduplicación no busca reducir el papel de las personas, sino redirigir su conocimiento donde es más prioritario. Los catalogadores pueden enfocarse en tareas de alto valor que los conecten con sus comunidades, en lugar de dedicar tiempo a resolver registros duplicados.
Además, los catalogadores y el equipo especializado de OCLC participan activamente en este proceso. A través del etiquetado de datos y valoraciones posteriores, los profesionales contribuyen a perfeccionar y mejorar la capacidad de la IA para identificar duplicados.
La IA como esfuerzo colaborativo y el camino por delante
No echo de menos las pilas de fichas ni las purgas trimestrales de archivadores, pero valoro profundamente lo que representaban. La IA no está sustituyendo ese cuidado, sino ampliándolo. Aunque las herramientas evolucionan, nuestros principios permanecen intactos. OCLC lleva años utilizando la tecnología para ayudar a las bibliotecas a gestionar sus catálogos y colecciones, y ahora aplicamos esa misma filosofía a la IA: de manera deliberada, efectiva y basada en nuestro compromiso compartido con la calidad de los metadatos. Este enfoque hacia la innovación permite a las bibliotecas adaptarse a necesidades cambiantes y ofrecer un mayor valor a sus usuarios.
Participe en la iniciativa de etiquetado de datos de OCLC y contribuya al perfeccionamiento del rol de la IA en la deduplicación.
La deduplicación impulsada por IA es un esfuerzo continuo y colaborativo que seguirá evolucionando gracias a las aportaciones de la comunidad y la supervisión profesional. Las contribuciones de los profesionales tendrán un impacto directo en la calidad y eficiencia de WorldCat, beneficiando a toda la comunidad bibliotecaria.
Comparison of Standard RAG systems and MemoRAG (Qian et al.)
In my post “ALICE - AI Leveraged Information Capture and Exploration”, I proposed a system that unifies a Large Language Model (LLM) with a knowledge graph (KG) to archive routinely lost information from literature generating events. While assessing project risks, we have further researched hallucination and semantic sprawl mitigation strategies. I have been focusing on representation learning and embedding space methods to reduce the need for external knowledge bases such as in Retrieval Augmented Generation (RAG) methods. Along the way, I discovered similar current research. In this post, we review “MemoRAG: Moving towards Next-Gen RAG Via Memory-Inspired Knowledge Discovery”, a novel approach to RAG by Hongjin Qian, Peitian Zhang, and Zheng Liu from the Beijing Academy of Artificial Intelligence; and Kelong Mao and Zhicheng Dou from Renmin University of China published in the ACM Web Conference 2025. MemoRAG integrates memory mechanisms that will help bypass the limitations of the traditional RAG models. MemoRAG extends previous RAG systems by incorporating a novel dual memory model architecture which uses a lightweight memory model for maintaining long-term information and a heavy weight generator model that refines its output. We will discuss failures of the classical RAG systems, new memory components of MemoRAG, its performance across various benchmarks, and relative advantages on challenging reasoning, long-context summarization, and ambiguity handling.
Challenges of Traditional RAG Systems
Although large language models have revolutionized natural language processing, they still tend to express weaknesses in hallucinating information, maintaining long-term information, dealing with complex queries, and synthesizing unstructured sources of information. “Retrieval-Augmented Generation for Knowledge-Intensive NLP Tasks”, Lewis et al. 2020 explains how RAG can bridge these gaps by allowing language models to leverage external databases in real time for improved accuracy and relevance . However, in “SG-RAG: Multi-Hop Question Answering with Large Language Models Through Knowledge Graphs 2024”, Saleh et al. show that traditional RAG systems largely fail when there is a need to perform tasks that are more complex, requiring much deeper contextual understanding, ambiguity handling, and synthesis across multiple sources.
Traditional systems are based on a retriever model that fetches relevant information from a pre-indexed knowledge base and a generator model which generates responses in light of the retrieved context. This works when the task is simple, fact-based question-answering but fails when dealing with more complex information or implicit queries that would require synthesis from multiple documents or databases. For example, answering a question that would only require retrieval from a single source and pulled via lexical/semantic similarity — like “when did Apollo 11 land on the moon” would be well served by traditional RAG systems. But a question about how some book develops a theme might involve stitching together different narrative elements with information from multiple sources, which is beyond the capability of most classic RAG systems. Also, when working with unstructured datasets, traditional RAG systems often fail in performance owing to their orientation toward finding an exact answer rather than synthesizing loosely related information.
Reliance on Explicit Queries: Current RAG systems rely on simple, explicitly defined queries to access relevant data. They are intended to perform relevance matching between the input query and curated knowledge bases. But in practice, information requirements are often not clear or explicit, so the system must guess the user’s intention before loading the relevant content. Questions that require explicit reasoning, for example, or indirect citations (such as understanding themes in a text) are difficult to solve using standard RAG methods.
Difficulty with Structured and Distributed Data: Most RAG schemes are designed to work well with structured databases, where information can be pulled from it based on defined input parameters. But any task involving unstructured data (narratives, reports, etc.) is still an issue. Furthermore, when evidence stretches across multiple parts of a dataset, RAG models are typically incapable of bringing all this information together. Multi-hop reasoning, in which we must connect evidence to other points of data, is notoriously challenging for such systems.
Context Window Limitations: LLMs operate on a finite context window and cannot take on large historical interactions or large datasets. Even in the context of RAG systems, this restriction still remains because retrieval algorithms are unable to bridge the gap between long-context processing and short-context processing in any meaningful way. As a result, RAG systems might retrieve weak or partial evidence when performing an exercise that requires inclusion of wide spread information.
Challenges in Query Refinement: One of the problems of RAG systems is that they do not properly sanitize queries for more optimal retrieval outcomes. When the input from the user is ambiguous, standard RAG methods lack tools to translate the query into a practical query. This inconsistency often leads to obfuscated or incomplete fetching which negatively affects the final output.
Limited Applicability Beyond Straightforward Tasks: Standard RAG systems are best suited to tasks such as question answering or simple summarization, for which knowledge retrieval is direct. But they are unable to perform well in more difficult situations like pooling scattered evidence across documents, understanding abstract or complicated questions (e.g., thematic analysis) and working in domain-specific contexts like legal or financial records.
MemoRAG’s solution to Traditional RAG challenges
MemoRAG addresses these challenges through its memory-inspired architecture. The central novelty in MemoRAG is a memory model that enables long-term information storage and retrieval. While previous RAG systems had been based on query-based usage of databases for every different task, MemoRAG proposed a twin-system architecture for memory integration. This architecture includes:
Lightweight Memory Model-Long-Context LLM: It compresses large data in memory tokens representing the whole database and providing clues for answering elaborate queries. Essentially, it acts like a summarizer that builds guideposts for the retrieval process.
LLM-heavy Generator Model: It fine-tunes the information retrieved and produces highly detailed responses in a coherent manner. It does exceptionally well on ambiguous queries, multi-hop reasoning, and summary insights with complexity.
Using this architecture MemoRAG, operates in three main stages:
Memory Formation: Memory model forms a truncated but semantic version of the database. The memory module takes raw input tokens (say, database entries) and compiles them as compressed memory tokens without discarding any semantic information. The mechanism for this is an attentional mechanism of transformers. For example:
The input tokens are passed over a series of transformer layers and context is taken in.
Memory tokens are introduced as long-term knowledge stores which it deciphers and encodes high-level semantic data of the input tokens.
Clue Generation: Depending on the query entered, the memory model produces "clues" intermediate to it, in other words, handwritten solutions to the query that will inform the retrieve. With a continuous append of memory tokens and the elimination of less meaningful data from the input string, the memory module gradually shrinks long inputs into an efficient and concise memory image. The process works similarly to how human memory works – in which short-term information is reduced to long-term memories.
Example: A query like “How does the report discuss financial trends?” might yield clues such as “Identify revenue figures from recent years” or “Locate sections discussing market growth.”
Evidence retrieval and Answer Generation: Based on clues, relevant evidence is pulled from the database and the generator model generates the final result. Memory tokens are used as a mediator between input data and output. When asked a question, the memory module returns cues that tell you what you can expect the answer to be and how to retrieve evidence.
MemoRAG’s memory architecture enables it to synthesize information from disparate sources, bridging the gap where the traditional RAG systems falter. This contributes to the following benefits over traditional RAG systems:
Long-Term Memory: MemoRAG achieves performance beyond the traditional limitations of finite context windows by using a memory model that can compress large data into an accessible representation.
Evidence-Based Retrieval: Clues provided by the system help to steer the retrieval, bridging the gap between a vague query and evidence.
Dual-System Design: Dividing the memory and generation functions between separate models makes MemoRAG free up computational space while maintaining accuracy.
To illustrate MemoRAG’s advantages, the paper compares MemoRAG with standard RAG by asking the question: “How the book convey the theme of love?” (referring to the Harry Potter series). Standard RAG fails to extract these implied relationships due to scattered evidence and poor formulation in the question. MemoRAG, however:
Creates an internal memory of the book.
Provides placeholder clues, for example defining relationships between characters.
Digs through the clues to pull out pertinent elements and builds a complete and precise solution. This is a way to demonstrate MemoRAG’s capability to handle implicit queries and distributed evidence effectively.
Training the Memory Module
The memory module must be trained at two different phases to ensure its efficacy:
Pre-Training: The memory module gets long contexts in the pre-training phase from various datasets (e.g., novel, papers, reports). That allows the model to learn how to squeeze and store semantics important elements in very long inputs. The RedPajama dataset, a large set of quality texts, was extensively used to do this.
Supervised Fine-Tuning (SFT): At the fine-tuning phase, the memory module is trained on task data in order to get the most clues possible. This entails:
To give the model a question, long context, and an answer.
Programming it to output intermediate hints between the query and the long context.
The authors designed 17,116 supervised fine-tuning samples to improve MemoRAG’s response in questions answering and summarization tasks.
Performance and Benchmark Evaluation
MemoRAG was tested against two benchmarks:
Standard Benchmarks: Applied to datasets including NarrativeQA (questions-asking), HotpotQA (multi-hop reasoning), and MultiNews (summaries of multiple documents).
ULTRADOMAIN, designed by the authors to test the ability of LLMs to handle long-context tasks across diverse domains like the Law, Finance, and Education. The evaluation tasks included both in-domain, closer to that provided for training the model and out-of-domain, meaning the contextual presentation involved new and unfamiliar settings.
In-domain tasks: MemoRAG demonstrates very solid gains over the comparator models in domains like Law and Finance, where precision and integration of information are key. As a simple example, in tasks dealing with legal matters, the memory model of MemoRAG allowed it to infer better relations between clauses.
Out-of-domain tasks: The performance of MemoRAG was also very impressive across out-of-domain settings, including summarization of philosophical works or fiction. It has secured a 2.3% gain compared to the top-performing baselines over the Fiction dataset by effectively synthesizing high-level themes and insights from long-context information.
Assessment metrics varied depending on the task but F1 score for questions and Rouge-L for summaries was the most common.
MemoRAG’s performance was benchmarked against several modern baselines:
Full Context Processing: Conveniently exposing the full context to large language models.
RQ-RAG: A query optimization framework which reduces queries into simpler subqueries.
HyDE: Creates fake documents for navigating the retrieved data.
Alternative Generative Models: MemoRAG’s generator model was compared to popular models such as Mistral-7B and Llama3-8B.
Multi-Hop Reasoning and Distributed Evidence
MemoRAG is unique in that it can support multi-hop reasoning, meaning that it draws evidence from multiple sources in order to formulate answers to complex questions. Whereas traditional RAG models evaluate each query in isolation, the memory component of MemoRAG enables information to be fetched and synthesized from a set of distributed sources. This is particularly helpful in domain-specific areas such as finance, where determining factors for revenue growth requires synthesis from a number of reports and inferences from a set of relationships such as expanded market and reduced cost.
Enhanced Summarization Capabilities
MemoRAG did a great job summarizing unstructured and long documents like government reports, legal contracts, and academic papers. Because of its global memory capabilities, summaries are more concise, detailed, and accurate than those generated by baseline systems. This makes the system particularly useful in areas of journalism, law, and academia that require a great amount of data synthesis.
Innovations in Memory Integration
MemoRAG encodes its tokens with crucial aspects of large-scale contexts. These tokens serve as the ways that enable the model to recall information from memory. This makes the model highly efficient on long-context tasks. Regarding training, MemoRAG involves a two-step process: unsupervised pre-training over large datasets and task-specific supervised fine-tuning. This guarantees that memory tokens are optimized for the generation of relevant clues with the goal of improving retrieval accuracy and speed.
ULTRADOMAIN benchmark results showed MemoRAG making massive gains:
On in-domain datasets (i.e., legal and financial contexts), MemoRAG scored an average F1 improvement of 9.7 points on the best-performing baseline.
MemoRAG outperformed baselines across 18 disciplines on out-of-domain datasets by an average of 2.4 points (showcasing its versatility). For example:
For financial data, MemoRAG scored 48.0 F1 score (40.8 by the nearest baseline).
In the long-context domain (e.g., college textbooks), MemoRAG did not degrade much even at extremely long context lengths.
MemoRAG’s advantage lies in its new clue-driven retrieval algorithm and memory model implementation. In contrast to conventional RAGs that find unreliable or redundant evidence, MemoRAG:
Finds semantically rich clues to refine retrieval.
Analyzes long contexts more effectively, without the truncation complications that conventional systems have.
Works well on difficult complex problems like multi-hop reasoning and summarization, where other solutions fall flat.
MemoRAG’s strategy of combining retrieval and generation of memory has important implications for developing artificial intelligence and its uses:
Scalability of AI Models: MemoRAG shows how memory modules extend the optimal context window of LLMs and allow them to consume datasets which were once considered too large. This would open the door for cheap AI solutions that can outperform big models without significantly more computation power.
Better Knowledge Discovery: By enabling an exchange of raw data to meaningful information, MemoRAG can support knowledge-intensive activities such as scientific research, policy analysis, and technical writing.
Personalization: Since it’s built with and stores long-term memory, MemoRAG can match individual user preferences and records to create personalized recommendations for entertainment, e-learning, and e-commerce.
Future AI Research: MemoRAG’s framework revolutionizes retrieval-based systems with its memory-inspired design. It might spur more research into hybrid architectures that integrate retrieval and memory better.
Conclusion: MemoRAG and the Future of Retrieval-Augmented AI
MemoRAG has addressed the fundamental drawbacks of traditional RAG architecture by adopting a memory-based architecture. With a memory module that produces global, context-dependent representations, MemoRAG is perfect for tasks involving complicated logic, extended contexts, and evidence gathering.
The framework scores very well on the ULTRADOMAIN benchmark for its versatility and power to handle both in-domain and out-of-domain datasets. Using it for everything from legal defense to conversational AI, MemoRAG reveals how memory-based systems can help to expand the limits of what a language model can be.
As AI systems mature, technologies such as MemoRAG could be the basis for handling even more sophisticated tasks, straddling the divide between retrieval and complex reasoning. My work on ALICE involves doing similar retrieval and clue systems via knowledge graph structure and the techniques used by MemoRAG will help inform ALICE’s development by both providing a comparative methodology to evaluate against and hints on how to achieve greater information coherence for truth grounded response. This performance by MemoRAG is a reflection of the next generation of AI systems that will be able to retrieve and generate information but also remember, infer, and synthesize knowledge in ways that are becoming increasingly indistinguishable from human cognition. As AI continues to evolve, it is models such as MemoRAG that will lie at the heart of nuanced information-based tasks characteristic of the modern world.
Jim Ecker
References
Qian, H., Zhang, P., Liu, Z., Mao, K., and Dou, Z., “MemoRAG: Moving towards Next-Gen RAG Via Memory-Inspired Knowledge Discovery”, 2024. URL https://doi.org/10.48550/arXiv.2409.05591.
Lewis P., Perez E., Piktus A., Petroni F., Karpukhin V., Goyal N., Kuttler H., et al., “Retrieval-Augmented Generation for Knowledge-Intensive NLP Tasks”, 2020, URL https://doi.org/10.48550/arXiv.2005.11401
Saleh, Ahmmad O. M., Tur, Gokhan., Saygin, Yucel., “SG-RAG: Multi-Hop Question Answering with Large Language Models Through Knowledge Graphs,” ICNLSP 2024. URL 2024.icnlsp-1.45
Weber, M., Fu, D., Anthony, Q., Oren, Y., Adams, S., Alexandrov, A., Lyu, X., Nguyen, H., Yao, X., Adams, V., Athiwaratkun, B., Chalamala, R., Chen, K., Ryabinin, M., Dao, T., Liang, P., Ré, C., Rish, I., and Zhang, C., “RedPajama: an Open Dataset for Training Large Language Models”, 2024. URL https://doi.org/10.48550/arXiv.2411.12372.
Kočiský, T., Schwarz, J., Blunsom, P., Dyer, C., Hermann, K. M., Melis, G., and Grefenstette, E., “The NarrativeQA Reading Comprehension Challenge,” , 2017. URL https://doi.org/10.48550/arXiv.1712.07040.
Yang, Z., Qi, P., Zhang, S., Bengio, Y., Cohen, W. W., Salakhutdinov, R., and Manning, C. D., “HotpotQA: A Dataset for Diverse, Explainable Multi-hop Question Answering” , 2018. URL https://doi.org/10.48550/arXiv.1809.09600.
Chen, J., Xiao, S., Zhang, P., Luo, K., Lian, D., and Liu, Z., “BGE M3-Embedding: Multi-Lingual, Multi-Functionality, Multi-Granularity Text Embeddings Through Self-Knowledge Distillation” , 2024. URL https://doi.org/10.48550/arXiv.2402.03216.
Chan, C.-M., Xu, C., Yuan, R., Luo, H., Xue, W., Guo, Y., and Fu, J., “RQ-RAG: Learning to Refine Queries for Retrieval Augmented Generation” , 2024. URL https://doi.org/10.48550/arXiv.2404.00610.
Jiang, A. Q., Sablayrolles, A., Mensch, A., Bamford, C., Chaplot, D. S., de las Casas, D., Bressand, F., Lengyel, G., Lample, G., Saulnier, L., Lavaud, L. R., Lachaux, M.-A., Stock, P., Scao, T. L., Lavril, T., Wang, T., Lacroix, T., and Sayed, W. E., “Mistral 7B” 2023. URL https://doi.org/10.48550/arXiv.2310.06825
This post is one in a series documenting findings from the RLP Leadership Roundtable discussions. It is co-authored by Rebecca Bryant and Chela Weber.It is the first of two blog posts that summarize outcomes from discussions focused on leadership in times of uncertainty and change.
Leading people and programs can be especially challenging during times of uncertainty and change. As many libraries grapple with budget constraints, staffing shortages, and resource limitations, the OCLC Research Library Partnership (RLP) created space for leaders to share challenges, learn from peers, and provide mutual support.
What is the most challenging aspect of your work in a leadership role today?
What’s been your approach to sunsetting or pivoting work on services, projects, or other activities, especially when those decisions are unpopular? Do you have underlying principles that guide your decision making? How do you balance short- and long-term priorities?
How do you effectively and transparently communicate during challenging times? How do you share enough without sharing too much? Do you have tools for supporting staff morale during extended periods of staff uncertainty?
We all dealt with the major crisis of the pandemic and the uncertainty it brought, some in leadership roles while others have come into leadership since. What have you learned from this or other past crises that you can apply now? What are you learning about leadership from observing senior leadership at your institution? Has anyone done anything that inspires you or lifts your own morale?
Fifty individuals from 43 RLP institutions across five countries participated in a total of eight 90-minute discussions. The discussions revealed that leadership challenges transcend national boundaries, though specific contexts vary. Common themes emerged around financial constraints, communication challenges, and the need for adaptive leadership strategies. RLP leadership roundtables observe the Chatham House Rule—no specific comments are attributed to any individual or institution, but a list of participating institutions is provided at the bottom of this post.
The resulting discussions were so rich that we couldn’t capture them all in one blog post. This is part one of the outcomes of our leadership discussions, and part two will follow shortly.
Budgetary and staffing pressures
Our discussions reveal a group of librarians and archivists grappling with a complex web of challenges while working to maintain operations and support staff.
Budget constraints. Library leaders face severe budget constraints as their most immediate challenge. Roundtable participants described how their organizations are facing cuts ranging from 5% to 33% for fiscal year 2026. One participant described their institution as already in a perilous condition following years of declining enrollment and budget recissions, and others described the precarity of state budgets.
Uncertainty abounds. One participant expressed concerns about how reductions to indirect costs will further impact library funding, prompting efforts to prepare campus faculty for potential library cuts. The uncertainty of when, and if, budgets will stabilize impacts morale.
Bristlecone pine by Bain Butcher, 2013. 2013 Artist-in-Residence, Great Basin National Park, USA.
Staffing pressurescompound these challenges. Hiring freezes and budget constraints force many institutions to operate with skeleton crews. One leader who lost one-third of their personnel in the last two years cannot rebuild due to hiring restrictions. Another institution self-imposed a hiring freeze to avoid future position cuts. Retention is another struggle; one leader explained, “I have lost staff simply because they cannot afford [to live in our city] on the amount that they get paid at the library.”
Operational impacts. Budget uncertainty and staffing shortages create cascading effects throughout library operations. Library staff at many institutions feel overworked, stressed, and overwhelmed. Morale is low. Staff take on new responsibilities without additional compensation, and several libraries reported reorganization efforts to address reduced capacity.
Strengthening morale through recognition and connection
Several participants described their efforts to build morale by engaging teams in meaningful work and providing authentic support.
Acknowledge fear and uncertainty. With staff feeling anxiety, “especially about job security,” several participants described the need to extend compassion and convey to staff that “it’s okay to not be okay.”
Connect to core purpose. It’s important to maintain a connection to the core mission despite challenges. External engagement seems particularly motivating. One leader noted: “When you’re with other people who are excited about your material, it gets you excited again” about the work. Another helps “my direct reports find work projects that they feel . . . like they’re doing something that is meaningful to them beyond just the kind of cultural heritage work that we normally do.”
Foster solutions-oriented thinking. Leaders struggled with team expectations to provide all the solutions, seeking ways to encourage solutions-oriented thinking.
Identify things you can’t fix. One participant helps staff identify “gravity problems”—issues that, like gravity, are not going to change and shouldn’t consume energy. Instead, they urge focus on problems that can be meaningfully addressed.
Promote collaborative work. Several leaders promote projects that allow staff to support each other rather than relying heavily on supervisory relationships. Through collaboration, “they see each other’s work, they are interdependent, they can support each other more.”
Convene solutions-focused meetings. Many use staff meetings to address roadblocks and encourage team members to “come with proposed solutions” rather than just problems.
Recognition and morale building. To buoy morale, many libraries have implemented regular recognition practices:
“60-second shout-outs” start meetings positively by allowing quick recognition of valued work
“Shout-out cards” let staff publicly recognize the work of others on cards posted in the staff break room
Celebrating achievements like publications, awards, promotions, and personal accomplishments at regular library meetings
Community events or “engagement days” convene staff members for team building and wellness activities. One institution recently hosted a kitten adoption event
Campus award nominations leverage institutional HR staff awards programs—for example, one institution has fostered a positive culture of appreciation through regular award nominations and wins
The impact of these efforts extends beyond individual recognition: “It’s been gratifying to see how supportive people are of each other, and this kind of peer support is meaningful to a lot of people, not just the person getting the shout-out.”
Strategic approaches to uncertainty and change
Facing budget and staffing uncertainties, library leaders described strategic approaches that focus on core services, scenario planning, and selective implementation of new initiatives. They looked to professional values and institutional priorities to guide their decision-making.
Planning strategies
Scenario planning. Participants’ institutions are conducting budget exercises to identify and maintain core services in anticipation of deep cuts. This “war footing” approach prioritizes core services with hopes of rebuilding later. Some included staff in documenting potential responses to different funding levels, facilitating informed decision-making. Several emphasized the need to take a library-wide view of cuts due to significant cross-departmental impacts.
Defining and identifying services. Informed decision-making requires understanding the depth and breadth of library activities. One institution created a comprehensive “service catalog” through a collaborative process to identify all services, including legacy offerings and those duplicated across departments. This approach reveals services they “don’t realize that we are doing” and serves as a “game changer” for the organization, supporting the library as it undergoes a significant restructuring to refocus services. Some institutions are working to clearly define what constitutes a “core service,” though this presents challenges as disagreement emerges about priorities.
Operational adaptations
Flexible contracts and purchasing. One institution is negotiating greater flexibility by shifting from multi-year to single-year purchasing contracts, requesting hardship clauses where single-year options aren’t available, and purchasing some resources outright instead of licensing to manage future uncertainty.
“Good enough” service standards. Participants agreed that libraries and archives cannot and should not continue to provide the same level of service with significantly reduced resources. Instead, one library is implementing a “good enough” approach that emphasizes sustainability over perfection.
Strategic sunsetting of services. Several institutions are examining services to discontinue, which can be challenging because staff are deeply invested in their work. Examples include ending conservation work on circulating collections after staff departures, sunsetting an under-resourced research information management system, and reallocating a data visualization position to geospatial support to fill strategic campus gaps.
Leveraging change
Crisis as opportunity. A few participants view recent challenges—including the pandemic and staff losses—as opportunities for positive change. These circumstances can serve as a catalyst for workflow reconceptualization, service prioritization, and improved institutional alignment, with one participant saying, “never let a good crisis go to waste.”
Visible service impacts. Some leaders are deliberately making service reductions visible to demonstrate the real impact of budget cuts, rather than maintaining the illusion that operations can continue unchanged. “I want them to be visible. I don’t want to not be able to serve people and make it hard to use our collections, but at the same time, I don’t think I do anyone a service . . . by pretending that we can continue to [work as we always have].” This transparency helps stakeholders understand the consequences of funding decisions.
Supporting staff through change
Managing staff expectations and morale. The identity-driven nature of archives and special collections work creates particular challenges when asking these staff to reduce their efforts. As one leader noted, “People draw a lot of identity from their work” which “makes asking them to scale back even harder.” Leaders are helping staff adjust expectations to match current realities to identify what can be paused, as well as working on realistic individual goal planning.
Boundaries and organizational support. Participants emphasized the need to ensure that service reduction decisions are supported throughout the organizational hierarchy, offering frontline staff the agency to set boundaries with users.
Looking ahead
These discussions accentuated that effective leadership during challenging times requires both strategic operational thinking and genuine care for people. Participants shared experiences that showed not only the weight of their decisions but also the collective strength found in peer networks, transparent communication, and a focus on meaningful work. The strategies they explored—scenario planning, morale-building practices, visible service impacts—reflect their efforts to balance institutional priorities with the well-being of staff and the communities they serve.
The strategies and insights shared by RLP affiliates offer support and resources for peers navigating similar challenges. As we continue to unpack their insights, the next post will delve deeper into practical approaches for fostering adaptive leadership and organizational resilience.
Roundtable participants
For the special collections roundtable in May 2025, 25 participants from 25 institutions attended:
Clemson University
National Library of New Zealand
Harry Ransom Center (University of Texas at Austin)
Cleveland Museum of Art
Smithsonian Libraries and Archives
University of Toronto
Cornell University
The New School
University of Utah
Emory University
University of Calgary
University of Washington
George Washington University
University of Arizona
University of Nevada, Las Vegas (UNLV)
Haverford College
University of Delaware
Vanderbilt University
Monash University
University of Kansas
Virginia Tech
Montana State University
University of Miami
National Library of Australia
University of Pittsburgh
For the research support roundtable in June 2025, 25 individuals participated from 23 RLP institutions:
Cold Spring Harbor Laboratory
Stony Brook University
University of Maryland
Institute for Advanced Study
Syracuse University
University of Sydney
Monash University
Tufts University
University of Tennessee, Knoxville
New York University
University of Arizona
University of Texas at Austin
Ohio State University
University of California, Irvine
University of Toronto
Penn State University
University of California, San Diego
University of Waterloo
Rutgers University
University of Delaware
Utrecht University
Smithsonian Libraries & Archives
University of Illinois Urbana-Champaign
Sincere thanks for Mercy Procaccini and Erica Melko for their suggestions that improved these posts.
AI Nota Bene: The co-authors leveraged AI in the writing of these blog posts. AI was used to identify key themes from notes and discussion transcripts, which was useful for developing the blog outline and some suggested quotes. We found AI useful for suggesting subheadings and more concise language. Nevertheless, we did the majority of the writing ourselves.
The field of library science is paying increasing attention to anthropogenic climate change by exploring best practices for mitigating damage from environmental disasters and participating in climate action. This work is valuable, but it does not necessarily take on the cultural dimensions of climate adaptation. How are unquestioned ideas about time and decay supporting the carbon-heavy preservation of archival materials? How can libraries promote interspecies kinship, consider the legacy of industrial colonialism, and acknowledge the emotional impact of environmental destruction? To approach these questions, this article introduces thinkers from the environmental humanities and Anthropocene scholarship and applies their work to the field of library science. It explores alternatives to linear concepts of time, affective materiality of archival objects, palliative death ethics, and Indigenous perspectives of climate change as the legacy of industrial colonialism. The article concludes by suggesting ways that institutions can promote cultural adaptation to climate change.
Novelist Ursula K. Le Guin begins her 1985 epic, Always Coming Home, with a brief chapter titled “Towards an Archaeology of the Future.”1 The most likely intention is not to promote new standards to modernize the field of archaeology (“towards an archaeology for the future”), nor is it to envision or influence what archaeological practice may look like decades or centuries from now (“towards a future archaeology”). Rather, the book is a fictional ethnography of a people living in what we know as California’s Napa Valley thousands of years from the present day. What Le Guin likely means by the phrase is the most grammatically simple yet conceptually brain-melting interpretation: to replace the past with the future as the object of archaeological study. She is telling us to turn our heads and look in the opposite direction.
The dissonance of studying the ruins of a society that doesn’t yet exist is apt for approaching the Anthropocene, the Earth’s current, unofficial geological epoch characterized by the ecosystem-altering impact of Homo sapiens and resulting planetary disruptions.2 Since the term was coined in the early 2000s, scholars from various academic disciplines have considered its implications as a framework that elevates human behavior to the level of worldshifting ecological events.3 One such discipline is the environmental humanities, a field that emphasizes narrative and culture in approaching environmental challenges. Through an interdisciplinary lens combining the political, anthropological, literary, and/or philosophical, the field is united by the belief that humans and nature are intertwined. The environmental humanities welcomes traditionally excluded or undervalued perspectives into the discourse, with a particular openness to the voices of Indigenous scholars and activists.
The field of library science is paying increasing attention to anthropogenic climate change. Librarians are exploring best practices for the logistical preparation of institutions for climate events like flooding and extreme heat4, advocating for reducing the environmental impact of industry-specific activities5, and discussing how libraries can promote and participate in climate action.6 This work is valuable as institutions physically adapt to an age of instability. However, it does not necessarily take on the cultural dimensions of climate adaptation that library science, with its predilection for the past and general focus on our own species, may need some nudging to address.7
How are unquestioned ideas about time and decay supporting the carbon-heavy preservation of archival materials? How can libraries consider the legacy of industrial colonialism, acknowledge the emotional impact of environmental destruction, and promote interspecies kinship? We need a librarianship of the future, in which librarians and archivists can build on theory from the environmental humanities to involve the public in thinking intergenerationally and imagining the possibilities for a world beyond the Anthropocene.
Time
Alternative concepts of time that have emerged within the environmental humanities challenge the prevailing ethos that archives exist to preserve the past for humans of the future. When we consider those humans in the context of the climate crisis, we are faced with blunt uncertainty.8 As Erik Radio puts it, a “continued existence of life,” or “one in which humans continue to act in a central role” or are “even recognizable as ourselves,” is in question.9 If the continuation of our species—either entirely, or with all the trappings of our current relationship with the planet—is not secure, then librarians must question the meaning of preserving materials for future humans who aren’t present or may not be able to access them.10 And of course, questioning the value of an activity should prompt us to consider the cost: in this case, the carbon-intensive resources used to preserve these materials for an uncertain human future.
Deep time, which places humanity in the context of the total 4.54 billion years of Earth’s existence, proliferates Anthropocene scholarship. Geographer Kathryn Yusoff suggests that the Anthropocene framing offers a “new temporality”11 by “embedd[ing]” our species in geologic time.12 This gives humans geological agency by placing us among the few entities that “possess the power of extinction”13 while “[shifting] the human timescale from biological life-course to that of epoch and species-life.”
Establishing ourselves in this broader geologic context opens up imaginative doors. While discussing the causal role of fossil fuel extraction and use in facilitating species extinction, Yusoff notes that this way of positioning humans in time reveals our own potentially declining species as the “material expenditure of the remains of late capitalism.” When we “[unearth] one fossil layer” to use as fuel for our machines, we “create another…that has our name on it.”14 By materializing humanity as a future fossil layer, Yusoff expands our idea of what the history and record of our species could entail moving forward.15 Radio gets at a similar notion in his effort to conceptualize archival documents in a posthuman world, suggesting that Earth is the “document that can serve as a contextual ground for all others,” and that therefore in the present libraries and archives should “strongly consider broadening their scope to incorporate the perspectives of geologists.”16
If Yusoff and Radio use geology to detach from anthropocentric concepts of time, then an emphasis on interspecies relationships within the environmental humanities offers a different approach. Potawatomi scholar Kyle Powys Whyte uses various Indigenous perspectives to inform what he calls “kinship time,” in which “time is told through kinship relationships that entangle climate change with responsibility”17 as an alternative to portraying climate change using the “ticking clock” narrative encouraged by the traditional Western, linear timescale.18
Whyte references Samantha Chisholm Hatfield et al.’s research on the connection between time and ecosystems among tribes like the Siletz in the Pacific Northwest, who have historically relied on ecological signals to track the passage of time. For example, an elder interviewed by Hatfield explains how the Siletz used to rely on the emergence of carpenter ants in the spring as a seasonal cue to start hunting pacific lampreys, a coastal fish species resembling eels, despite the fact that the two species are not ecologically related. These days, though, the elder says that the “weather’s changed so much that you can’t mark anything like that” anymore. This example represents a broader trend from Hatfield’s research: multispecies relationships like the ones between humans, ants, and lampreys demonstrate a foundational way of telling time and connecting to the universe for the Siletz. When climate change threatens the ecosystem, it jeopardizes that “sense of order”19 and results in feelings of “abruptness and escalation.”20
This way of telling time based on environmental cues is part of what Whyte (2018) refers to elsewhere in his research as a “seasonal round system” employed by peoples like the Anishinaabe/Neshnabé, in which public life is “organized to change and shift throughout the year to adjust to the dynamics of ecosystems.”21 He also describes “spiraling time,” which brings together ancestors and their descendants22, as well as Hatfield et al.’s explanation of time “based on a 3D construction” of ecological relationships.23 By using these visual metaphors, Whyte seeks to reject linear time in favor of worldviews prizing interconnectedness and responsibility.
Le Guin sought to do the same in her fictional ethnography Always Coming Home. The subjects of the book, far-future residents of California’s Napa Valley who are known as the Kesh, see all living things as people, and therefore “no distinction is made between human and natural history.”24 They conceive of time as less structured than Le Guin’s (likely Western) reader does; the ethnographer informs us that “time and space are so muddled together that one is never sure whether [the Kesh] are talking about an era or an area.”25 When the ethnographer tries to ask a Kesh librarian-historian of sorts for information about previous inhabitants of the region, it initiates a roundabout discussion that ultimately leads the ethnographer to conclude,
It’s hopeless. He doesn’t perceive time as a direction, let alone a progress, but as a landscape in which one may go any number of directions, or nowhere. He spatialises time; it is not an arrow, nor a river, but a house, the house he lives in. One may go from room to room, and come back; to go outside, all you have to do is open the door.26
This spatial conceptualization of time is directly tied to the Kesh’s assumptions of interspecies kinship. Their world is one in which human people live in balance, respect, and partnership with all others. Therefore they refer to us—that is, industrial Western civilization in the present day, which, per our linear perspective of time, existed long ago in their past and was ultimately destroyed by an intervening ecological apocalypse—as “the time outside,” and “when they lived outside the world.”27
If people of all species who exist in other millennia are just across the threshold, how does it change the way we connect to the earth and other beings? And what does it mean for a field like library science that is paradoxically oriented toward both past and future, where materials from the past are collected and preserved for the benefit of future generations? Is it possible to extract library science from linear time, like one might extract a glittering stone from a running stream?
Removing distance from our sense of time has some interesting implications for collections. Within the past-orientation, if people from many years ago are a short distance away, then age is less of a factor in deciding which of their objects or papers are worth preserving. If a British colonist named Gilberrt Bant living in 1690s Boston, for example, is just across the threshold then how important is it to keep a receipt from when his father left him money?
Within the future-orientation, on the other hand, if people from later epochs are on the other side of the door, then it may incentivize concern for future beings in how we choose to preserve materials and consume resources. It’s the proximity principle: if we can see our descendants right there in our front yard, we are more likely to consider them as we choose what and how we collect and preserve.28
Clearly, this extreme shift in perspective requires intergenerational thinking. Kyle Whyte’s spiraling time encourages us to “consider ourselves as living alongside future and past relatives simultaneously” throughout our lives.29 Philosopher Julia Gibson takes it a step further in their discussion of palliative death ethics for climate change, suggesting that past and future life does not just surround us, but in fact, is present within us as individuals. This is because “the dead, the dying, the living, and those yet-to-be are not only distinct generations of beings along a linear sequence but coexistent facets of every being.” That is, outside of linear time, an individual occupies the past, present, and future all at once. As such, Gibson calls for rejecting the “‘us in the present’ vs. ‘them in the future’” dichotomy in climate change discourses.30
Intergenerational thinking gives librarians the opportunity to consider our entire way of determining the value of objects we collect and preserve. Is constantly cooling and dehumidifying the room where we store Gilberrt Bant’s receipt worth releasing the carbon that will threaten our descendants’—or our own—access to sufficient food, or livable temperatures, or safety from mega-storms? Is it worth contributing to the ongoing mass extinction of other species?
Mortality
Let’s consider the objects themselves. Archivist Marika Cifor calls on the rise of new materialism in recent feminist theory to inform what she terms the “liveliness” of physical matter in an archival setting. Building on Karen Barad’s “entanglement of matter and meaning,”31 Cifor writes that matter is “animate and imbued with a particular kind of agential and affective vitality.”32 To her, “humans and objects are fundamentally and crucially interrelated” in a way that cannot be fully expressed with words, giving objects a “materiality” that “resists language.”33
Cifor experiences this first-hand in the archives when she encounters the bloodstained clothing that gay rights activist Harvey Milk was wearing when he was assassinated in 1978. Touching the clothes and their stains gives her an “intimate experience of horror in the archives that blatantly refuses intellectualisation” and makes her understand Milk in an entirely new way.34 The emotionally affective capacity of archival objects isn’t limited to horror, though. Cifor also visits Yale University’s Beinecke Special Collections Library to encounter the personal “Stud File” of Samuel Steward, a prominent gay figure from the twentieth century. She describes the feeling of disgust, the “messy space between desire and repulsion,” she experienced when she found pubic hairs taped to a couple of records in Steward’s homemade card catalog of sexual partners.35
Of course, as most librarians can attest, archival objects can also invoke less complicated feelings like awe. This is part of our motivation for preserving items like Bant’s receipt, or a 1796 Irish state lottery ticket, or a Neo-Babylonian cuneiform tablet from circa 626-539 BCE documenting the receipt of money and barley. Beyond their functional context or intended purpose, we keep them available for the pleasure of being in proximity to objects that are old. But preserving items because of their age ultimately undermines their liveliness and agency. This is because, per Cifor, archives are “in a state of constant flux, shifting with each new intra-action of the various and changing actors that constitute it.”36
Dani Stuchel discusses this in the context of physical, non-human actors like sunlight and moisture that interact with archival materials on a chemical level to prompt their gradual deterioration. Decay is an “expression” of archival entropy—the state of constant, ongoing movement and change that applies to all objects—because it “reveals aspects of materiality not visible in earlier states” as it goes on.37
Traditional preservation attempts to pause this process, leading to what, to me, is one of the many intriguing contradictions arising from this line of research: the attempt to delay the inevitable by keeping an object “alive” imposes stasis, while the process toward death indicates liveliness and vibrancy. Stuchel, though, makes a different and more nuanced point. Rather than decay implying “action” and preservation implying inaction, Stuchel argues that action takes place regardless:
[N]o archival [material] stays ‘pristine’ on its own: the appearance of stasis or sameness is continually constructed through archival action. Alongside these actions, we continually re-accept the renewed thing as ‘original’ or ‘authentic.’ The postmodern refrain of performativity echoes on here: an archival thing is constantly becoming an archival thing.38
If archival materials can make us feel things and are constantly changing, then perhaps letting them change can help us emotionally grapple with broader instability. Stuchel calls for “introspection” on “the psychological impulses which drive our need to keep, evince, retrieve, and preserve,”39 suggesting that a fear of letting objects decay—and therefore “forgetting” them from the cultural memory—indicates a broader fear of our own death.40 Le Guin suggests the same via her narrator in Always Coming Home:
Perhaps not many of us could say why we save so many words, why our forests must all be cut to make paper to mark our words on, our rivers dammed to make electricity to power our word processors; we do it obsessively, as if afraid of something, as if compensating for something. Maybe we’re afraid of death, afraid to let our words simply be spoken and die, leaving silence for new words to be born in.41
What happens emotionally if we let our resistance to archival entropy soften? Stuchel points to “very human feelings”42 that we miss when we reject the possibility of decay, since we can “mediate our grief about and connection to the past” through these “transitional or memorial objects.”43 When the archival object represents a way of life that climate change may take away, witnessing its death gives us an opportunity to engage with a broader mourning process.44
And in a culture whose mainstream discourse refuses to explore collective acceptance of change or publicly grieve the ongoing losses wrought by environmental destruction, engagement with these feelings is vital. In Gibson’s palliative death ethics for climate change and extinction, simply not looking away is critical. We must “[refuse] to neglect [our] ecological partners even as they are…leaving us.”45 Giving up the illusion of control is key here. As Cifor notes on materiality in archives, “affect disrupts the notion of an intentional and agential human subject in full control of the matter with which they engage.”46 This is true of both archival objects and our planet in the Anthropocene.
Finality
It is difficult, to say the least, to understand how the effects of anthropogenic climate change will play out and to glimpse possible futures as a result. This is due in part to what Rick Crownshaw calls the Anthropocene’s “problems of scale,” which he writes are “becoming something of a mantra” in memory studies in particular and the humanities and social sciences more broadly.47 Because it is “unfolding unevenly across time and space, matter and life (human and nonhuman), and through planetary systems and processes (engendering systemic feedback loops and crossing the threshold of systemic tipping points),” the Anthropocene’s effects are only discernible “through a ‘derangement’…of the scales of cognition, remembrance, and representation.”48 He considers the “‘humanist enclosures’ of cultural memory studies” to be “ill equipped” to manage these various scales.49
This dissonance is akin to the challenge of thinking intergenerationally when a person has only ever perceived oneself as existing within linear time. It is at play in efforts to conceive of archives in a future that may lack human cultural institutions as we know them today.50 It is the grand contradiction, daunting obstacle, and essential task of anticipatory memory, in which we attempt to envision the conditions of future beings in order to join them in retroactively observing our own time and remembering the critical period that took place between our present and theirs.51 That period is wrapped up, perhaps, with survival.
Of course, survival can be difficult to imagine when reports about record temperatures and points of no return stir up an anxious urgency that collides with broadly avoidant apathy52 and overwhelming inadequacy at the highest political levels. The outlook can seem rather bleak. However, as Gibson cautions us, there is a difference between “attending centrally to grief and death” and “becoming fatalistic,”53 and it is important to consider the implications of succumbing to the latter.
Whyte offers a useful perspective of survival as he considers dominant Western state-of-emergency or apocalypse narratives of climate change. From the perspective of Indigenous peoples, an apocalypse has already taken place. They have already experienced what the rest of us dread most about climate change—“ecosystem collapse, species loss, economic crash, drastic relocation, and cultural disintegration”—and are currently living in their ancestors’ version of a dystopia.54 Therefore, he argues, the state-of-emergency narrative is flawed because it veils the dominant culture’s continued benefit from colonization55, promotes a hasty reliance on solutions from the systems of irresponsibility that got us here in the first place and favor protecting the status quo56, and prevents humans from slowing down and prioritizing intra- and interspecies kinship in the process.57
Whyte highlights scholars Heather Davis and Zoe Todd’s view of industrial colonialism as a “seismic shockwave” that “compact[s] and speed[s] up time, laying waste to legal orders, languages and place-story in quick succession.”58 It caused the “violent, fleshy loss of 50 million Indigenous peoples in the Americas,” and now via climate change its “reverberations” are starting to impact the imperial nations that first started it.59 He urges readers to resist general narratives of “finality” and “lastness” put forth by non-Native climate advocates that conceptualize change as “describing movement or transition from stability to crisis—where crisis signals an impending end.”60 That’s because such narratives discount the already existing apocalyptic circumstances of Indigenous communities under settler colonialism explained above.
Whyte also argues that those portrayals belie the fact that, as uncomfortable as it is for these non-Native allies to admit, many are living in their own ancestors’ version of a fantasy. They are benefitting from both the generations-long destruction of Indigenous ways of life and the legal and moral justification of that destruction, while framing themselves as “protagonists” who can “save Indigenous peoples” from a newly and urgently precarious position—which, Whyte notes, “their ancestors of course failed to do.”61 By neglecting to acknowledge the legacy of industrial colonialism when approaching anthropogenic climate change, Western systems of power risk perpetuating it further.
A related critique that arises in environmental humanities scholarship takes issue with the Anthropocene’s implication that all human beings constitute a single, forceful entity. It may seem like a “neutral” concept, according to Kathryn Yusoff, but it is based on a politics that “universalises the inheritance and responsibility for fossil fuel consumption”62 despite that consumption’s uneven distribution across the globe. Davis and Todd read the Anthropocene as an “extension and enactment of colonial logic [that] systemically erases difference,”63 and they would rather acknowledge those varying levels of responsibility.64 This narrative flattening of numerous human communities existing across a broad spectrum of emissions, consumption, and culpability for climatic effects is a concern that white Westerners like me should consider when writing about the Anthropocene and its impact.
It may seem contradictory to reject finality as part of the Anthropocene narrative while advocating for palliative death ethics in our approach to climate change, so it is crucial to clarify the difference. Le Guin has an oft-quoted line: “We live in capitalism, its power seems inescapable—but then, so did the divine right of kings.”65Late capitalism, a phrase that has become ubiquitous on the Left in recent years, echoes Le Guin’s hopefulness. Both seek to transcend the imaginative shortcomings of linear time imposed on those experiencing it by giving language to the eventual end of an entrenched system whose mythology relies on perpetuity and endless expansion.66
For those trapped in a linear time perspective, on the other hand, there is nothing “late” about our experience of capitalism because there is no end in sight. Considering how climate change works, it might alternatively be reasonable to wonder if it is too late, since we’re only now feeling the effects from carbon emissions decades ago, and the effects of today’s emissions won’t be felt for decades more. Too late for what, though? Perhaps it is too late for Homo sapiens; or perhaps, as Yusoff posits, capitalism may be what goes extinct instead of our species.67
This is the difference between mortality and finality. We can expect not to outlive capitalism while understanding that others will. We can acknowledge death intimately and locally while also thinking intergenerationally and acting with care for humans and other beings we may never meet. We can employ the “geographic imaginations”68 enabled by the Anthropocene to try to take on its problems of scale. The end of one person’s, or one society’s, or one species’s way of life is not an end to all.
Remembrance and Responsibility
Gibson emphasizes the act of remembrance as an “ongoing communal ethic” that “matters deeply” under conditions of environmental injustice.69 As some of the cultural spaces best positioned to attend to public remembrance, institutions like libraries and archives must try. Luckily, library science’s broad range of involvement with the public provides diverse opportunities to engage with this work.
For archives and special collections, Stuchel suggests that the ephemerality of cultural heritage objects can activate public care and remembrance. Stuchel advocates for geographer Caitlin DeSilvey’s concept of curated decay, in which an item’s “disintegration” is “incorporated into heritage practice.”70 This approach lets us “work with the entire ‘lifecycle’ of a thing”71 and consider its ecological context72 as it disintegrates. Incorporating decay into the public’s experience of materials could achieve the emotional engagement with mortality described above while also fulfilling what, according to Samantha Winn, is “both an ethical imperative and a functional exigency” of archivists to “develop practices which do not require infinite exploitable resources.”73
There are also plenty of opportunities for the public to engage with the issues discussed here via library programs that foster dialogue about death ethics, cultural adaptation to climate change, and alternative concepts of time. Oral history projects and time capsules are a great way to get patrons thinking more deeply about their position in time and space. So are traveling displays like A People’s Archive of Sinking and Melting, an art exhibit and global community archive that solicits objects linked to climate events from around the world. Public libraries can also take advantage of their genealogical resources to invite patrons to interrogate linear visualizations of time and participate in speculative dialogue with their ancestors and descendants.74 And many public libraries already engage mental health professionals to facilitate programming, so the scope of those sorts of programs could expand to include climate-related stress and anxiety.
There is also potential for public and academic libraries to facilitate public mourning and remembrance. They can create programming around Remembrance Day for Lost Species, an annual international observance started by U.K. artists in 2011 that takes place November 30th of each year.75 They can engage artists and activists to create physical memorials to extinct species onsite in and around library spaces. And they can host grieving rituals like the funeral for the Okökull glacier held by activists in Iceland in 201976, embroidery artist Kate Tume’s Hallowed Ground project embroidering critically endangered animals’ habitats while leaving empty space in the shapes of the beings themselves, and the nondenominational Earth Grief event that took place at Bombyx Center for Arts and Equity in Florence, Massachusetts in July 2024.
And then, of course, there’s fiction. There is a reason why so much environmental humanities scholarship overtly employs speculative fiction to theorize77; here Le Guin’s Always Coming Home informed an entire way of conceptualizing time. Fiction frequently serves as our only frame of reference for imagining our shared climate future. Its authors, through their extensive worldbuilding, provide kernels of possible detail about the conditions of our intergenerational reality that can help readers begin to reckon with the changes they are facing in the context of coexisting geopolitical and socioeconomic factors.78 Beyond devoting budgetary resources to purchasing speculative climate fiction for their collections, libraries can organize programming like book clubs and writing workshops to encourage their patrons to explore the genre further.
Donna Haraway, who is a bit of a celebrity among environmental humanists, advises us to envision the Anthropocene as “more a boundary event than an epoch” and reduce it as much as we can in order to move on to a future in which the trajectory has changed.79 Colebrook describes that next possible epoch as one in which “humanity might think beyond itself to a life of which it is only a contingent organic part.”80 But making this vital shift—the one that Rick Crownshaw believes cultural memory studies is “ill equipped” for—comes at a cost.
Whyte calls that cost “[giving up] the underlying conditions of domination that dispossess Indigenous people.”81 Yusoff calls it the “sacrificial responsibility” to leave fossil fuels in the ground.82 Roy Scranton calls it “adapting, with mortal humility, to our new reality.”83
This piece seems critical, and it is where I intend to take this research from here. Perhaps, by more explicitly exploring library science’s relationship with time, commodity fetishism, and industrial colonialism, we can begin to parse the meaning of “mortal humility” for our field.84 Here and now, from our location within linear time, we must enact a kinship-based, mortality-embracing, finality-resisting, intergenerational way forward. We need a librarianship of the future.
Acknowledgments
I’d like to thank reviewers Katherine Witzig and Ryan Randall, as well as publishing editor Ian Beilin, for all of their work in preparing this piece for publication. Another huge thanks goes to Donia Conn for guiding me through the research and writing process; her willingness to say yes and her frank concern for the future of our planet have made me feel at home in this field. Thanks, also, to Eric Poulin, Jude Graether, Simmons University’s School for Library and Information Science, and all of the friends and family who welcomed my conversations about time and trees and extinction in the summer of 2023 as I recovered from reading The Overstory by Richard Powers.
Bibliography
Ahmed, Sara. The Cultural Politics of Emotion. New York: Routledge, 2004.
Atkinson, Jennifer. “Mourning Climate Loss: Ritual and Collective Grief in the Age of Crisis.” CSPA Quarterly, no. 32 (2021): 8–19. https://www.jstor.org/stable/27090383.
Barad, Karen Michelle. Meeting the Universe Halfway: Quantum Physics and the Entanglement of Matter and Meaning. Durham: Duke University Press, 2007.
Calhoun, Joshua. The Nature of the Page: Poetry, Papermaking, and the Ecology of Texts in Renaissance England. Material Texts. Philadelphia: University of Pennsylvania Press, 2020.
Chisholm Hatfield, Samantha, Elizabeth Marino, Kyle Powys Whyte, Kathie D. Dello, and Philip W. Mote. “Indian Time: Time, Seasonality, and Culture in Traditional Ecological Knowledge of Climate Change.” Ecological Processes 7, no. 1 (December 2018): 25. https://doi.org/10.1186/s13717-018-0136-6.
Cifor, Marika. “Stains and Remains: Liveliness, Materiality, and the Archival Lives of Queer Bodies.” Australian Feminist Studies 32, no. 91–92 (April 3, 2017): 5–21. https://doi.org/10.1080/08164649.2017.1357014.
Clark, Timothy. “Derangements of Scale.” In Telemorphosis: Theory in the Era of Climate Change, edited by Tom Cohen, 1:148–66. Critical Climate Change. Open Humanities Press, 2012. https://durham-repository.worktribe.com/output/1656912.
Craps, Stef, Rick Crownshaw, Jennifer Wenzel, Rosanne Kennedy, Claire Colebrook, and Vin Nardizzi. “Memory Studies and the Anthropocene: A Roundtable.” Memory Studies 11, no. 4 (October 2018): 498–515. https://doi.org/10.1177/1750698017731068.
Cunsolo, Ashlee, and Neville R. Ellis. “Ecological Grief as a Mental Health Response to Climate Change-Related Loss.” Nature Climate Change 8, no. 4 (April 2018): 275–81. https://doi.org/10.1038/s41558-018-0092-2.
Davis, Heather, and Zoe Todd. “On the Importance of a Date, or, Decolonizing the Anthropocene.” ACME: An International Journal for Critical Geographies, December 20, 2017, 761-780 Pages. https://doi.org/10.14288/ACME.V16I4.1539.
de Massol de Rebetz, Clara. “Remembrance Day for Lost Species: Remembering and Mourning Extinction in the Anthropocene.” Memory Studies 13, no. 5 (October 2020): 875–88. https://doi.org/10.1177/1750698020944605.
Gibson, Julia D. “Practicing Palliation for Extinction and Climate Change.” Environmental Humanities 15, no. 1 (March 1, 2023): 208–30. https://doi.org/10.1215/22011919-10216250.
Le Guin, Ursula K. “Speech in Acceptance of the National Book Foundation Medal for Distinguished Contribution to American Letters.” Ursula K. Le Guin. Accessed April 28, 2025. https://www.ursulakleguin.com/nbf-medal.
Le Guin, Ursula K., Todd Barton, Margaret Chodos-Irvine, and Shruti Swamy. Always Coming Home. New York : London: Harper Perennial, 2023.
Lewis, Simon L., and Mark A. Maslin. “Defining the Anthropocene.” Nature 519, no. 7542 (March 2015): 171–80. https://doi.org/10.1038/nature14258.
Lövbrand, Eva, Silke Beck, Jason Chilvers, Tim Forsyth, Johan Hedrén, Mike Hulme, Rolf Lidskog, and Eleftheria Vasileiadou. “Who Speaks for the Future of Earth? How Critical Social Science Can Extend the Conversation on the Anthropocene.” Global Environmental Change 32 (May 2015): 211–18. https://doi.org/10.1016/j.gloenvcha.2015.03.012.
Radio, Erik. “Documents for the Nonhuman.” Journal of Critical Library and Information Studies 3, no. 1 (May 17, 2020). https://doi.org/10.24242/jclis.v3i1.108.
Sharpe, Christina Elizabeth. In the Wake: On Blackness and Being. Durham London: Duke University Press, 2016.
Stuchel, Dani. “Material Provocations in the Archives.” Journal of Critical Library and Information Studies 3, no. 1 (May 17, 2020). https://doi.org/10.24242/jclis.v3i1.103.
Whyte, Kyle P. “Indigenous Science (Fiction) for the Anthropocene: Ancestral Dystopias and Fantasies of Climate Change Crises.” Environment and Planning E: Nature and Space 1, no. 1–2 (March 2018): 224–42. https://doi.org/10.1177/2514848618777621.
Whyte, Kyle Powys. “Time as Kinship.” In The Cambridge Companion to Environmental Humanities, edited by Jeffrey Cohen and Stephanie Foote. Cambridge University Press, 2021.
Winn, Samantha R. “Dying Well In the Anthropocene: On the End of Archivists.” Journal of Critical Library and Information Studies 3, no. 1 (May 17, 2020). https://doi.org/10.24242/jclis.v3i1.107.
Yusoff, Kathryn. “Geologic Life: Prehistory, Climate, Futures in the Anthropocene.” Environment and Planning D: Society and Space 31, no. 5 (October 2013): 779–95. https://doi.org/10.1068/d11512.
Lewis and Maslin, “Defining the Anthropocene,” 171. A committee of academics from the International Commission on Stratigraphy formally rejected the designation of the Anthropocene as an epoch in March 2024 after fifteen years under consideration. Its conceptual significance to disciplines beyond geology, however, was cemented during that time. See this update from Nature for more information on the committee vote and Lewis and Maslin’s article for further context on the Anthropocene and its geological markers. ︎
Lövbrand et al., “Who Speaks for the Future of Earth,” 211. ︎
This and the preceding two quotations are from Yusoff, 784. ︎
Along these lines, Claire Colebrook sees the Anthropocene as an “inscriptive event” whose impact depends on the “intensity of inscription” on our planet. Craps et al., “Memory Studies,” 507-508. ︎
Radio, “Documents for the Nonhuman,” 4-5. While perhaps unsettling to conceive of ourselves as the future material record itself rather than its interpreters, the blurred boundary between human and matter in an archival context should not come as a surprise; what Yusoff is positing is simply a different approach to what archivist Marika Cifor calls an “understanding of humans and matter as mutually constitutive.” Cifor, “Stain and Remains,” 8. Cifor considers the affective materiality of human remains in archival settings when she comes across late gay rights activist Harvey Milk’s ponytail in the GLBT Historical Society’s archives in San Francisco. What separates Milk’s hair from Yusoff’s fossilization of bone into rock due to the species-ending effects of fossil extraction is the scale of time in which the Anthropocene encourages us to place ourselves as we consider the historical record. ︎
Le Guin, Always Coming Home, 169. The Kesh language does not broadly distinguish between humans and non-humans, but rather treats all beings with respect and agency. This was likely informed by Le Guin’s extensive research of Indigenous relationships with land in writing the novel. See Robin Wall Kimmerer’s Braiding Sweetgrass for more insight into animacy in Native languages and Le Guin’s “Legends for a New Land” speech to learn more about the novel’s inspiration and writing process. ︎
Craps et al., “Memory Studies and the Anthropocene,” 501. Here Crownshaw is applying Timothy Clark’s concept of “derangements of scale” to memory studies. Clark, “Derangements of Scale.” ︎
Craps et al., 501. David Wallace-Wells sheds some light on these problems of scale in his New York Magazine piece detailing likely climate scenarios over the next century. Reasons for our “incredible failure of imagination” regarding this issue include “the smallness (two degrees), and largeness (1.8 trillion tons), and abstractness (400 parts per million) of the numbers,” as well as “the simple speed of change and, also, its slowness, such that we are only seeing effects now of warming from decades past.” Wallace-Wells, “Uninhabitable Earth.” He also explains multiple examples of the feedback loops Crownshaw refers to, including projections of melting permafrost and drought-induced rainforest fires releasing enormous amounts of carbon into the atmosphere and therefore continuing the cycle. The article, though accessible and informative, is not for the faint of heart. ︎
Whyte, “Ancestral Dystopias,” 226-7. Whyte cites various scholars and activists who have written or spoken about this general idea, including Lee Sprague, Larry Gross, Grace Dillon, and Conrad Scott. ︎
Davis and Todd, “Decolonizing the Anthropocene,” 772. ︎
Davis and Todd, 774. The authors note the connections between their seismic shockwave concept and scholar Christina Sharpe’s “wake work,” a metaphor illustrating the ongoing effects of the transatlantic slave trade using the image of the ships’ wake. “In the wake, the past that is not past reappears, always, to rupture the present.” Sharpe, In the Wake, 9. Davis and Todd seek to “expand and pluralize collective understandings of the disasters of the Anthropocene” (772). ︎
Le Guin, “Speech.” She spoke these words in 2014, when she was eighty-four years old, during her acceptance speech for the National Book Foundation’s Medal for Distinguished Contribution to American Letters. The context for the comment involves seeking accountability for the publishing industry’s greed and the pressure it puts on artists in its effort to maximize profits. Earlier in the speech she says, “Hard times are coming, when we’ll be wanting the voices of writers who can see alternatives to how we live now, can see through our fear-stricken society and its obsessive technologies to other ways of being, and even imagine real grounds for hope. We’ll need writers who can remember freedom—poets, visionaries—realists of a larger reality.” ︎
As labor expert Richard Yeselson told the Atlantic in 2017, “Let’s allude to the big, giant, totalistic system that is underneath everything. And let’s give it more than a hint of foreboding. Late capitalism. Late is so pregnant.” Lowrey, “Late Capitalism.” ︎
For further discussion of the ecological context of manuscripts and archival documents through an environmental humanities lens, see Calhoun, Nature of the Page.︎
Instances of this phenomenon cited in this article alone include Gibson, “Practicing Palliation;” Whyte, “Ancestral Dystopias;” Craps, “Anticipatory Memory;” Winn, “Dying Well;” and Haraway, “Making Kin.” ︎
In one example, Tochi Onyebuchi’s Goliathconsiders the effects of gentrification on poor, Black residents of New Haven, Connecticut when Earth’s atmosphere is cleaned up and the global elite return from their outer space enclaves. In another, Yoko Tawada’s Scattered All Over the Earth puts a surreal spin on language and climate migration. I led discussions about both books with patrons for Lilly Library’s Climate Fiction Book Club in Florence, Massachusetts in 2023-2024. ︎
Nora Almeida and Jen Hoyer provide a model for this line of research in “Living Archives in the Anthropocene,” parsing the relationship between the Anthropocene, capitalism, and archival practice to highlight an alternative, decentralized “living” structure embodied by Interference Archive in Brooklyn, New York. ︎
In July, OKFN is bringing together non-technical professionals – including data practitioners, communicators, project managers, and advocates – to rethink how technology supports our work in conversational sessions.
LibraryThing is thrilled to announce that Talpa Search is now available in Aspen Discovery from Grove for Libraries. With Talpa Search, patrons can search for books and other media using natural language. Talpa Search goes beyond traditional library searching to find items by plot details, genre, descriptions, and more. While Talpa Search works with all library systems, this is its first integration directly inside the catalog.
Aspen Discovery libraries can now enable Talpa Search as a search mode, allowing patrons to see results from Talpa Search seamlessly integrated into the look and feel of their library catalog.
Talpa Search in Aspen Discovery enables users to search for “novels about France during World War II” or “recent cozy mysteries” and receive relevant results, all within their existing library catalog, without special syntax or filtering.
Just as patrons will love the ability to search their library catalog using natural language, librarians will appreciate the customization options available with the Talpa Search module, including branding, text, and display settings. Talpa Search also includes an optional setting to display a materials request link for items not owned by the library—useful as a collection development tool.
Talpa Search is available by subscription and can be accessed through a standalone site for those without Aspen Discovery. You can see the Talpa Search catalog integration in action here, and the stand-alone site at https://www.talpasearch.com/.
About Grove for Libraries
Grove for Libraries offers development, hosting, support, and more for Aspen Discovery, Aspen LiDA, and other projects related to Aspen. Grove employees also contribute time and expertise to all Aspen Community meetings as well as dedicated Office Hours to help grow and support all libraries and organizations using Aspen. Learn more at https://www.groveforlibraries.com/
About Talpa Search
Talpa Search combines cutting-edge technology with data from libraries, publishers, and readers to enable entirely new ways of searching—and find what you’re looking for.
Designed specifically for libraries, Talpa Search is available by subscription, has no usage caps, and integrates with a library’s catalog and holdings.
Talpa Search was developed by the developers, librarians, and librarian-developers of LibraryThing. Learn more at https://www.talpasearch.com/about.
“Talpa” means mole in Latin. (Moles dig for things!)
About Aspen
Aspen is a suite of open-source library software that started with its flagship Discovery and has since expanded to include additional tools like the Aspen LiDA mobile app and Aspen Web Builder.
Aspen was the first discovery layer to give patrons seamless access to all library resources in one place. By connecting with multiple content platforms for e-books, library events, digital archives, and other third-party services, Aspen is dedicated to avoiding vendor lock-in and empowering libraries with control by offering them options for which vendors they want to integrate with Aspen.
Aspen is used by more than 2,000 libraries worldwide and is supported by a vibrant community of hundreds of librarians. Learn more at https://community.aspendiscovery.org/
The Executive Director of The Demography Project reports on their experience piloting ODE: "It rekindle the spark that inspires why we do our work and boosted my team’s collegiality."
The goal of this proposal is to investigate the feasibility of generating hypotheses through interactions between expert LLMs and then ranking hypothesis candidates by Z-scores, a novelty metric developed by Dr. Uzzi.
The project will advance hypothesis generation by improving the hypothesis novelty in the candidate generation phase and the candidate selection phase. The introduction of Z-scores provides a more scalable way to automatically evaluate novelty. The multi-agent LLMs will have the potential to mitigate the consistent mistakes and biases made by a single LLM. Existing research mostly relies on data from one narrow domain (e.g., ACL). The introduction of multiple expert LLMs will overcome the limitation by generating cross-domain hypotheses. We plan to use this exploratory effort to study the scaling efficiency of our methods for larger science datasets that cover most STEM domains (e.g., with scale - Web of Science or CiteSeerX, etc.) and are crucial to leverage cross-disciplinary knowledge for scientific discovery.
Dr. Jian Wu, the PI of this project, is an associate professor of Computer Science at Old Dominion University, Norfolk, VA. His research interests include natural language processing, scholarly big data, information retrieval, digital libraries, and the science of science.
Dr. Tirthankar Ghosal is a Staff Scientist at Oak Ridge National Laboratory’s National Center for Computational Sciences (NCCS) and will serve as Co-PI on this project. His research expertise spans AI for Science and Operations, Natural Language Processing, Large Language Models, and Machine Learning.
Dominik Soós is a PhD student of Computer Science at Old Dominion University, where he also received his B.S. and M.S. degrees in Computer Science. His research interests include natural language processing, machine learning, and parallel computing.
Let me back up a little. I spent April gathering and May refining and organizing requirements for a system to replace our current ILS. This meant asking a lot of people about how they use our current system, taking notes, and turning those notes into requirements. 372 requirements.1
Going into this, I knew that some coworkers used macros to streamline tasks. I came out of it with a deeper appreciation of the different ways they’ve done so.
It made me think about the various ways vendors are pitching “AI” for their systems and the disconnect between these pitches and the needs people expressed. Because library workers do want more from these systems. We just want something a bit different.
A Few Ways We’re Using Macros
Some environmental factors: We use Sirsi Symphony and the Workflows desktop client in Windows with MacroExpress.
Canned Notes
One of the simplest things we do with macros is add canned notes. These are most often action notes, which have to be added to existing records. For example, this is a standard deacidification note:
Deacidified.|c20030107.|iliquid.|xBookkeeper.|jCranberry Township, PA 16066.|kPreservation Technologies Inc.
The text string is the same every time except for the subfield c, which grabs today’s date, e.g. 2003-01-07 in the example above.
Spine Label Marking
Let’s look at something more complicated. Our marking team has a set of tasks they need to perform when setting an item’s permanent location and preparing a label. They use a macro that does the following:
If it’s in the respective library’s main stacks: update Home Location field to the location which corresponds with the Library field (e.g. if it’s at Altoona, it would be STACKS-AA).
Copy the call number to the clipboard, with some line breaks.
If the Home Location has a special marking prefix: prepend the marking prefix, again with line breaks. This data isn’t in Symphony at all, it comes from a separate marking table.
They then can paste the result into the label software, ensure the line breaks are correct, and print a label.
This saves them:
Clicking in the Home Location field and typing or scrolling to find the correct Home Location (when it’s in the main stacks, otherwise they still have to do this part).
Clicking in the call number field and copying the data.
Opening our locally-maintained marking documentation, checking whether the Home Location is in the prefix table, and copy-pasting that separately into the labeling software.
The marking table used by MacroExpress requires regular maintenance, but it’s done in parallel with updates to our department’s documentation.
One macro.
Annex Location Management
We also use Symphony to manage our Annex data. There are pros and cons to this, but I’ll be focusing on how macros makes the work much easier.
When an item moves to an annex, our team needs to update the following information:
The item’s Library and Home Location fields
The item’s very specific position within that annex
The second piece of information is encoded in a new barcode. We want to record this data in our Extended Item Information fields (locally mapped) which we use for everything from retrieval to reporting. We need to be able to identify everything in a row, a shelving unit, box, even position in box. So we need it broken apart in a way that can be easily queried or used to generate pull slips. We also want to record information about the size of the box (A3, A4, etc.).
To use the macro, our Annex workers click in the barcode field, press a key on their numpad, and scan in the new barcode. This performs the following steps:
Update barcode with the new barcode
Update the Library field to UP-ANNEX
Update Home Location to the specific annex at which the work is being performed
Fill in locally-mapped Box Size field using a lookup table and the value entered from the numpad.
Fill in a set of locally-mapped Extended Item Information fields with the values of Row, Shelf, Box, and Position within the box based on the value of the barcode.
They use a special numpad which is just an ordinary external numpad that’s had labels applied to its keys. These indicate which key maps to A3, which to A4, etc. Users don’t have to memorize “Press 7 for A3,” they just have to press the A3 key.
Once again, the macro eliminates the human error factor that would come with manually typing or even cutting and pasting in any of this data. It transforms a task that would take a good minute of clicking, tabbing, typing/copy-pasting into one that takes maybe 10 seconds.
One macro.
Why Macros, Not “AI”
To summarize at a more abstract level, we are using macros to:
At its best (pattern-recognition), “AI” is overengineered for what we need: logic and lookups.
At its worst (predictive text), it’s the opposite of the very concrete and repeated things we want to be able to do.
It doesn’t have to be macros. My coworkers would welcome a system which let them create custom workscreens with only the few fields they need for a regular task and let them add their own conditional logic. 3 Or they could collect barcodes and run a batch process that inserts those deacidification notes with canned text and a variable date field vs. running the macro on each record.
But the direction is one of control, of refinement, of engaging with the system on one’s own terms. That is in contrast to the black box we’re being presented by both “AI” companies and library system vendors.4
As for me? I’m excited about APIs.
Some of those requirements are: “Staff users can check in and check out library materials.” On the one hand, yes of course. On the other hand, a friend’s university just implemented a system in which you can only hire people on the first day of a pay period. No, you can’t hire them on the second day and make it retroactive. Sometimes you have to ask about really, really basic stuff. ↩︎
I’m thinking here in particular of the ways that our use of macros significantly reduces the need to tab between fields or scroll through controlled values in Workflows. ↩︎
I have seen some good ones developed at individual institutions using APIs. ↩︎
As I’ve said elsewhere, I think OCR and machine-learning capabilities which can support catalog record creation could be helpful! I’ve also seen great uses of these tools to transform a scanned page into a tab-separated file or reformat existing data quickly. The problem is that we’re being offered tools that also generate non-existent page counts we have to clean up or ones that propose taking over course design for faculty (ELUNA 2025 plenaries). ↩︎
I keep my personal reading log in an Emacs org-mode table. It's nice and small, and works on every computer I use, and thanks to org-mode's spreadsheet feature, I can even do some basic analysis of it. I use a fancy capture template to collect the information about each book and store it at the end of the log without having to open the log file, navigate to the end of the table, and tab through the various fields.
Since it's also possible to post to the Mastodon microblogging platform from Emacs thanks to the mastodon.el library, I figured it shouldn't be too difficult to automatically post to mastodon every time I start reading a new book. And guess what! I was right.
This relies on the fact that org-mode provides "hooks" to customize the note capture process. A hook is a lisp function that gets run by emacs whenever the corresponding event takes place. In this case, org-mode provides several hooks related to finishing up the note capture process. The normal hooks are "org-capture-before-finalize-hooks", which run before org-mode cleans up everything related to capturing the note and gives you access to the captured note, and "org-capture-after-finalize-hooks", which runs at the very end of the note capturing process, which org-mode describes as "Suitable for window cleanup." These hooks run every time you capture any kind of note, but recent versions of org-mode also provides a way to define "before-finalize" and "after-finalize" hooks that only run when a particular capture template is used, so that's what I did.
At the end of my existing "make a note about starting to read a book" template, I added the extra option
:before-finalize #'djf-org-share-reading
which tells org-mode to run the hook djf-org-share-reading only when the "start reading a book" template is launched, and then I defined the function djf-org-share-reading:
(defun djf-org-share-reading () (when (require 'mastodon nil t) ;; parse out the org-capture data (let* ((capture (buffer-substring (pos-bol) (pos-eol))) (split-line (split-string capture "|+" t " +")) (author (car split-line)) (title (cadr split-line)) (language (caddr split-line))) (save-excursion ;; Create the mastodon toot buffer, insert the captured ;; Org information, and then post it. (mastodon-toot) (insert (format "I just started reading %s by %s%s" title author (if (string-equal language "F") " in French" ""))) (mastodon-toot-send)))))
First, I make sure that mastodon is available and loaded, then I grab and process the information about the book that I'm reading, then I call mastodon-toot to set up a buffer for creating a post, insert the message that I want to post, and then tell mastodon.el to send the post. If I haven't logged into Mastodon from Emacs yet, the call to "mastodon-toot" will automatically log me in. Mastodon takes care of the posting and getting rid of the buffer holding my draft post, and once djf-org-share-reading returns, org-mode cleans up the buffer it used to save the note, and I'm right back where I started in Emacs before I made the note.
I cannot ask my library catalogue to give me a list of Canadian Law Reviews and Journals we currently subscribe to but I *can* ask Wikidata which Canadian Law Review titles are open access..
In this series, we wanted to take a few moments to celebrate some of the amazing tools that have been developed for and by librarians (and other library pros). These often fill a vital gap in workflows or solve a pain point that library staff encounter in their work. We don’t mean the big tools [...]
The 6th RESAW (Research Infrastructures for the Study of Archived Web Materials) conference took place in Siegen, Germany from June 4 – June 6, 2025. The conference occurs every other year in Europe, and features a mix of presentations along the spectrum from technical to digital humanities, by researchers affiliated with universities as well as from national and commercial web archiving organizations. The conference started off with quite a flurry when Cologne was evacuated following discovery of WWII bombs, disrupting many travel plans into Siegen.
Wednesday
Workshop: Mentorship for Early Career Scholars in Web Archive Studies
The Mentorship for Early Career Scholars in Web Archive Studies workshop started with participants introducing themselves. There were PhD students, postdocs, and mentors. Then, participants wrote down questions they had about web archive studies. The mentors characterized the questions into similar topics such as ethics, publishing, and methods. Then because the group was so large, we split into two groups for discussion. My group included Emmanuelle Bermès, Susan Aasman, Anders Klindt Myrvoll, Inga Schuppener of Siegen University, Marina Hervieu of BnF and Skybox blogs project, Beatrice Cannelli of the University of London, Louis Ravn of University of Amsterdam and Marcus Rommel of Siegen University. Some of the topics we discussed include how there are standard guidelines for legal use but not ethical use, how access policies can hinder dissemination, and how to engage with web archive content of underrepresented communities. One of the takeaways of the workshop was that there should be a Zotero list of papers for getting started with web archive research. The organizers of RESAW have attempted this a few times now, and ODU participated in a similar initiative CEDWARC previously as well.
Thursday
Keynote: Conference Opening Session
The opening keynote by Niels Brügger traced the history of the RESAW workshop. He also introduced the demographics of participants, which heavily skews European. There are 95 registered participants from 11 countries, and 40 presentations over the two and a half days of the conference.
RESAW 2025 attendees came from 11 countries.
RESAW 2025 attendees primarily live in Europe.
Next, Carolin Gerlitz of University of Siegen talked about the host lab, the Media of Cooperation, funded as a Collaborative Research Centre. She introduced the idea of the datafied web, and observed that “The web is full of things that were not meant to be saved.” She questioned whose view is being preserved. She also stated that the true value of data lies in its ability to be remixed, rather than its amount.
Carolin Gerlitz gave the opening keynote about the datafied web.
Finally, Mara Bertelsen and Sophie Gebeil gave an entertaining skit on the publication of the previous RESAW conference’s proceedings, including props and audience participation. Everyone was entertained by the skit’s portrayal of the challenges of publishing a multinational volume.
Roundtable: The Datafied Web
The opening roundtable on the datafied web started with each of the five panelists - Sebastian Gießmann, Thomas Haigh, Carolin Gerlitz, Anne Helmond, and Miglė Bareikytė - introducing their view of the datafied web. Sebastian Giessmann shared his view related to his research on the history of online payments that datafication is a result of capitalism. Next, Thomas Haigh talked about how database management systems are transitioning towards NoSQL to accommodate vector (LLM) and graph (social media) models. He stated that there was never a web that wasn’t datafied, and that it matters how data is stored because web archives capture traces of the web but it’s not the original data.
Carolin Gerlitz followed by asking what is being measured on the web, how, and who is doing the measuring. She talked about page counters on the web transitioning to social media reactions and further to LLMs learning from our input. Next, Anne Helmond talked about data in the context of blogs and her work with Carolin on social media reactions. Finally, Miglė Bareikytė, who researches war sensing, talked about her work with archiving Telegram chats and channels in the context of the Russian invasion of Ukraine, as 70% of Ukrainians use the software. She stated that an archive that is not used is easily forgotten, and that once users know they are being archived, it changes how they behave.
Questions for the panel included how to study power relations in the context of the datafied web, and what kind of data the panel would like to have from the current web. The panel gave the Covid-19 app collection at the Internet Archive as an example of modern archived data.
Session: Web Archives Practices
The “web archives practices” session opened with Vasco Rato of the Portuguese Web Archive presenting “Bulk access to web-archived data using APIs”. The Portuguese Web Archive has four public APIs: full text search, image search, CDX, and Memento. They stated that the archive now holds 1.4 petabytes of information, and approximately half of the requests come from APIs now. Some examples of projects that have been built using the APIs are the Gloria Portuguese LLM, and the 1st place Arquivo.pt 2023 Awards winner project “Viajar no tempo sobre carris” which aligned CDX schedule data with full text news data.
Next, Eveline Vlassenroot of Ghent University presented, “Navigating the Datafied Web: User requirements and literacy with web archives.” Belgium does not currently have a web archive, so the Belgicaweb is a three year project to develop an archive, with FAIR principles in mind. She conducted a user study with mixed methods. She found that users want curated collections with transparent documentation about selection, as well as search interfaces. One of the main differences in this user study compared to past web archive user studies is that users are requesting datasheets and APIs. She is working on a web archive user literacy framework and researcher playbook including ethical guidelines for her PhD work.
Finally, Helena Byrne of the British Library presented “Lessons learnt from preparing collections as data: the UK Web Archive experience.” The initial framework was presented at the previous RESAW conference in 2023. Now, there is a toolkit published, and an online self-paced course is also available through the University of London. The UK Web Archive (still offline) has applied the framework to 10 collections, released under a creative commons license.
Session: Social Media and APIs
In the social media and APIs session, Katie Mackinnon of the University of Copenhagen presented, “Robots.txt and A History of Consent for Web Data Capture.” She talked about the development of robots.txt by Martijn Koster, and how it is a gentleman’s agreement to follow it. She traced policies at the Internet Archive around robots.txt, culminating in the 2017 blog post that they will no longer follow it. She also showed a 1995 post on the webcrawler mailing list asking for a zip file of the entire internet for AI purposes, which the audience found humorous. She also talked about the study by Longpre et al. which traced how website managers are using robots.txt to restrict access to their content by crawlers for LLMs.
Christian Schulz of Paderborn University next presented “On Reciprocity - Algorithmic Interweavings between PageRank and Social Media.” He talked about comparable systems for ranking authority of social media, such as pingbacks, and also talked about how users can manipulate their authority ranking on social media, including the “like4like” strategy. The final presenter in the session was Christina Schinzel of Bauhaus University, Weimar. She presented, “APIs. How their role in the history of computing and their software engineering principles shape the modern datafied web.” She traced the appearance of the term API to the paper, “Data structures and techniques for remote computer graphics.” She talked about the history of APIs on the web, and how they have led to interconnected ecosystems.
Friday
Session: Web Archives Practices
Lesley Frew presenting “Temporally Extending Existing Web Archive Collections for Longitudinal Analysis.” Photo courtesy of Eveline Vlassenroot.
In the Web Archives Practices session, I presented our work, “Temporally Extending Existing Web Archive Collections for Longitudinal Analysis.” Our pre-print is available on arXiv. We extended the EDGI 2016-2020 federal environmental changes dataset back to 2008 to analyze whether the terms being deleted by the first Trump administration were added by the Obama administration. We described our methodology, which used past web crawling, the End of Term 2008 dataset, and the Wayback Machine CDX API. We found that 87% of the pages with terms deleted by the first Trump administration contained deleted terms originally added by the Obama administration.
Next, Andrea Kocsis presented, “Engaging audiences with the UK Web Archive: Strategies for general readers, data users, and the digitally curious.” She worked with three groups of users on a computational skills spectrum: general readers do not have experience with web archives, data users have heavy experience with computational use of web archives, and in between are the digitally curious, for example users with some Jupyter notebook experience without specific web archive data experience. She also worked on a first of its kind physical web archive exhibit called “Digital Ghosts - Exploring Scotland’s Heritage on the Web.” Andrea’s research can be found on GitHub.
Finally, Ricardo Basílio presented “Seed lists on themes and events on Arquivo.pt: a curious starting point for discovering a web archive.” He talked about his methodology for obtaining lists of seeds, which includes both automated (Bing) and manual (individual and community) seed list development. He pointed out that automated methods like scraping a seed URL for additional URLs do not result in correct seed lists for very specific collections, such as a list of Portuguese art galleries, since external links wouldn’t be restricted to only Portuguese art galleries, which necessitates manual curation. WSDL has also done previous work on seeds and collections, including scraping social media for micro collections by Alexander Nwala and summarizing collections by Shawn Jones.
Andrea Kocsis, Ricardo Basílio, and Lesley Frew at the Web Archives Practices session discussion. Photo courtesy of Eveline Vlassenroot.
The way that the sessions are structured at RESAW is that all presenters give their presentations back-to-back, and then all presenters answer questions together in a panel. Here are some of the questions that the audience had for my presentation.
In the My PhD in 5 Minutes session, there were three web archives PhD students who presented their dissertation topics. One of the questions by the chair Jane Winters was to further summarize their PhD to one sentence of what they wanted people to take away. Nathalie Fridzema of the University of Groningen presented, “Before WEB 2.0: A Cultural History of Early Web Practices in the Netherlands from 1994 until 2004.” She wants people to take away the rich history of the Dutch web found in web archives. Anya Shchetvina of Humboldt University presented, “Manifesting The Web: Network Imaginaries in Manifesto Writing Between the 1980s and the 2020s.” She wants people to take away that manifestos have persisted over time but changed. Johanna Hiebl of European University Viadrina presented, “Battlefield of Truth(s) on Investigative Frontlines: From Data Activism to OSINT Professionalism.” She wants people to take away an open source methodology that is ethical for social sciences. There were no other parallel sessions during this time, so all 100 RESAW attendees came to this session and were able to ask questions to the presenters.
Roundtable: RESAW - The First 10 Years and What’s Next
In the RESAW business session roundtable, the panelists (Susan Aasman, Emmanuelle Bermès, Kat Brewster, Iris Geldermans, James Hodges, Tatjana Seitz, and Jesper Verhoef) engaged with each other and the full conference audience about what is to come. One of the successes they discussed was that there is value in non-US centered conferences in the topics studied. One of the challenges was that because RESAW is currently almost entirely European attendees, they wish to increase geographical diversity to Africa and South Asia. There was also an extensive discussion about having “less” (in the context of what web archives hold), but there were concerns about who decides what is deleted and how, and in a complementary sense who decides what is kept.
Session: Conference Closing
The RESAW conference is an informal, international, interdisciplinary web archives conference.
The RESAW conference happens every other year, and the locations are announced four years in advance (so for the next two conferences). RESAW 2027 will be in Groningen, Netherlands, and RESAW 2029 will be hosted by C2DH in Luxembourg.
Conclusion
I enjoyed attending RESAW because it brought together 100 interdisciplinary web archive researchers. The interdisciplinary departments represented include digital humanities, media studies, information science, and computer science. While representatives of web archiving organizations were present at the conference, the focus was on individual research rather than products or tools. I liked seeing the different methodologies that non-computational scholars use with web archives for their research. I hope that WSDL can attend this conference regularly in the future.
We’ve scattered a shower of rainbows around the site, and it’s up to you to try and find them all.
Decipher the clues and visit the corresponding LibraryThing pages to find a rainbow. Each clue points to a specific page right here on LibraryThing. Remember, they are not necessarily work pages!
If there’s a rainbow on a page, you’ll see a banner at the top of the page.
You have just under two weeks to find all the rainbows (until 11:59pm EDT, Monday June 30th).
Come brag about your shower of rainbows (and get hints) on Talk.
Win prizes:
Any member who finds at least two rainbows will be awarded a rainbow badge. Badge ().
Members who find all 12 rainbows will be entered into a drawing for one of five sets of LibraryThing (or TinyCat) swag. We’ll announce winners at the end of the hunt.
P.S. Thanks to conceptDawg for the scarlet ibis illustration.
ConceptDawg has made all of our treasure hunt graphics in the last couple of years. We like them, and hope you do, too!
CLIR is pleased to announce that the program is now available for the in-person Digital Library Federation’s DLF Forum happening in Denver, Colorado November 17-19, 2025.
The DLF Forum welcomes digital library, archives, and museum practitioners from member institutions and beyond—for whom it serves as a meeting place, marketplace, and congress. Here, the DLF community celebrates successes, learns from mistakes, sets grassroots agendas, and organizes for action. The Forum is preceded by Learn@DLF, our pre-conference workshop day on November 16. Learn more about the events.
A challenge with storage is the longevity of the media and the availability of hardware capable of retrieving it. While paper tape and punch cards are long-lasting and can be read by enterprising enthusiasts of today, modern densely packed SSDs and spinning disks might present more of a challenge for the archivists of tomorrow.
The future of archival data storage is tape, more tape, and then possibly glass-based tech, with DNA and other molecular tech still a distant prospect.
The function of archival storage is to keep data for the long term – decades and beyond – reliably and affordably. Currently, the main medium for this is LTO tape and it is slow, has a limited life, and not enough capacity considering the implications of ever-increasing image and video resolution and AI-infused data generation. However, there is as yet no viable tape replacement technology at scale, only possibilities, with optical storage more practical and nearer to productization than DNA or other molecular storage.
Mellor mostly agrees with me, but is more optimistic about Cerabyte's technology than I am. It is less aggressive than Project Silica, writing a single layer of data onto glass tablets. He reports that:
Cerabyte has attracted investment from In-Q-Tel, Pure Storage, and Western Digital. Shantnu Sharma, WD's Chief Strategy and Corporate Development Officer, said: "We are looking forward to working with Cerabyte to formulate a technology partnership for the commercialization of this technology."
...
Like Project Silica, it is, in our assessment, two to five years away from commercial product availability, but it will then be commercially available.
In early May, independent digital storage analyst Thomas Coughlin shared news of falling sales and revenue in the first quarter of 2025, continuing a trend that started in around 2010. Coughlin cites data from that year showing around 600 million annual hard disk shipments.
In 2025 he thinks around 150 million units will make it out of factory doors.
Hyperscale datacenter operators will buy most of them and have become HDD manufacturers' largest customers.
...
While HDD volumes fall, collective annual shipped HDD capacity is rising – so even though fewer machines are made, they collectively contain more gigabytes than last year's larger disk fleet.
Seagate is currently shipping 30 TB conventionally recorded Exos M HAMR drives and both 32 and 36 TB shingled magnetic recording (SMR) drives. These have blocks of partially overlapping write tracks to increase track density and thus overall capacity, but with a slower rewrite speed as entire blocks of tracks have to be rewritten.
The company should have a clear drive capacity advantage, but it does not because its HAMR technology has proven extraordinarily difficult to bring into mass production and it has one less platter than competing drives. By 2012, Seagate predicted it could make 1 Tb/in² in HAMR drives after a successful demo. That did not happen but it managed to make 16 TB HAMR drives and was sampling them in 2019. They did not make it to mass production either, and a 20 TB technology was the next development. It too did not last long.
CEO Dave Mosley told investment analysts in 2020 that Seagate was stepping up to 24 TB HAMR drives. By 2023, a 30 TB HAMR drive was said to be coming. This was actually unveiled in January 2024, with the tech branded Mozaic 3+, referring to the 32 and then 36 TB SMR variants.
Mellor notes the impact this history has had on Seagate's credibilty:
Seagate has previously made several predictions about HAMR drive availability that were not ultimately achieved. The tech giant appears to have persistently underestimated how long it will take to productize HAMR technology and so reap the production cost benefit of having fewer platters and sliders at any capacity point than its two competitors.
For a good time, I thought would use distant reading computing techniques to define the word "intelligence", specifically, "artificial intelligence".
I began by searching arxiv for pre-prints contgaining the phrase "artificial intelligence". This resulted in approximately 15,000 records. Using the records' abstracts as proxies for the articles themselves, I created a Distant Reader study carrel ("data set") from the citations. To give you an idea of the carrel's size and scope, the data set is 2.6 million words long (where the Moby Dick has about 0.25 million words long), and a word cloud illustrating the data set's keywords follows:
I then extracted all of the sentences from all of the abstracts. I vectorized ("indexed") the sentences, and stored the result in a database. I then searched the index for the word "intelligence" and specified the index to return the single closest sentence from the result. Apparently the closest sentence comes from an article called "The relationship between Biological and Artificial Intelligence" by George Cevora (2019 - https://arxiv.org/abs/1905.00547):
Intelligence can be defined as a predominantly human ability to accomplish tasks that are generally hard for computers and animals.
Not a great definition because it defines things in the negative, but a good start, if you ask me.
In order to garner a more well-rounded definition, I expanded my query to return 20 sentences, and I got the following result:
This paper is a survey of a large number of informal definitions of ``intelligence'' that the authors have collected over the years. Finally, we survey the many other tests and definitions of intelligence that have been proposed for machines. Independent from the still ongoing research in measuring individual intelligence, we anticipate and provide a framework for measuring collective intelligence. Our understanding of intelligence is directed primarily at the human level. In this regard, intelligence becomes a product of information processing. In such a case, intelligence arises as a result of information processing. The discussion at hand is about the elements that constitute the canonical idea of intelligence. We define intelligence as the ability to acquire skills that narrow this search, diversify it and help steer it to more promising areas. To accomplish this, we focus on three basic aspects of intelligence. Intelligence today is considered as a fundamental property of each and every living being. Intelligence can be defined as a predominantly human ability to accomplish tasks that are generally hard for computers and animals. Artificial Intelligence An important aspect of intelligence is the ability to adapt to a novel task without any direct experience (zero-shot), based on its relationship to previous tasks. Intelligence is not a single weighable quantity but a subject that spans Biology, Physics, Philosophy, Cognitive Science, Neuroscience, Psychology, and Computer Science. (Artificial Intelligence) Is understanding a necessary and sufficient condition for intelligence? The disadvantages of this type of intelligence are discussed. Artificial Intelligence Nonetheless, most of these systems lack many capabilities that we would naturally consider to be included in a notion of "intelligence". Human intelligence has the remarkable ability to assemble basic skills into complex ones so as to solve complex tasks.
Such is more difficult to consume, but if I measure the cosine distances between each sentence and its sucessor, I can tranform the result into pseudo-paragraphs, which is (usually) easier to consume:
This paper is a survey of a large number of informal definitions of ``intelligence'' that the authors have collected over the years.
Finally, we survey the many other tests and definitions of intelligence that have been proposed for machines. Independent from the still ongoing research in measuring individual intelligence, we anticipate and provide a framework for measuring collective intelligence. Our understanding of intelligence is directed primarily at the human level. In this regard, intelligence becomes a product of information processing. In such a case, intelligence arises as a result of information processing. The discussion at hand is about the elements that constitute the canonical idea of intelligence. We define intelligence as the ability to acquire skills that narrow this search, diversify it and help steer it to more promising areas. To accomplish this, we focus on three basic aspects of intelligence. Intelligence today is considered as a fundamental property of each and every living being. Intelligence can be defined as a predominantly human ability to accomplish tasks that are generally hard for computers and animals. Artificial Intelligence An important aspect of intelligence is the ability to adapt to a novel task without any direct experience (zero-shot), based on its relationship to previous tasks. Intelligence is not a single weighable quantity but a subject that spans Biology, Physics, Philosophy, Cognitive Science, Neuroscience, Psychology, and Computer Science. (Artificial Intelligence) Is understanding a necessary and sufficient condition for intelligence? The disadvantages of this type of intelligence are discussed. Artificial Intelligence Nonetheless, most of these systems lack many capabilities that we would naturally consider to be included in a notion of "intelligence". Human intelligence has the remarkable ability to assemble basic skills into complex ones so as to solve complex tasks.
This particular example is not extraordinarily helpful because only two "paragraphs" are returned. This tells me each sentence is very similar to its predecessor.
To distill the original results another way, I can submit it to an LLM and tell the model to summarize:
The paper surveys various informal definitions of intelligence and proposes a framework for measuring collective intelligence independent of individual intelligence research. The authors define intelligence as the ability to acquire skills that narrow, diversify, and steer search towards more promising areas. They focus on three aspects of intelligence: (1) adapting to novel tasks without direct experience (zero-shot), (2) assembling basic skills into complex ones to solve complex tasks, and (3) understanding. The paper also discusses the limitations of artificial intelligence systems in terms of their lack of certain capabilities that are inherent in human intelligence. Finally, the authors argue that intelligence is a multidisciplinary subject that spans biology, physics, philosophy, cognitive science, neuroscience, psychology, and computer science.
Again, not bad, especially if you take the time to close read the pseudo-paragraphs.
Finally, I submitted the original results to another LLM, but this time I posed a question, "What is intelligence?", and what follows is the result:
Intelligence is a multifaceted concept that has been studied and debated by various disciplines, including biology, psychology, neuroscience, philosophy, and computer science. At its core, intelligence can be defined as the ability to acquire and apply knowledge, skills, and adaptability in various tasks and situations. This includes the ability to process information, learn from experience, and solve complex problems.
The canonical idea of intelligence suggests that it is a fundamental property of living beings, including humans, animals, and potentially even artificial intelligence. However, there are also different types of intelligence, such as zero-shot learning, which allows AI systems to adapt to novel tasks without any direct experience.
The discussion around intelligence often focuses on the elements that constitute it, such as the ability to learn, reason, and adapt. While understanding is considered a necessary condition for intelligence, it may not be sufficient on its own. Other factors, such as creativity, problem-solving skills, and emotional intelligence, are also important aspects of human intelligence.
Despite the progress made in artificial intelligence, most systems lack many capabilities that are considered essential for true intelligence, such as common sense, creativity, and emotional intelligence. Therefore, while AI can perform certain tasks with great efficiency, it may not be considered truly intelligent in the way that humans are.
In summary, intelligence is a complex and multifaceted concept that encompasses various aspects of information processing, learning, and adaptability. While AI systems have made significant progress in mimicking human-like intelligence, there are still many capabilities that are unique to humans and may not be easily replicable by machines.
So? What's the point? We are all suffering from information overload, and we use various tools to help us overcome this problem. Some of those tools include: tables of contents, back-of-the-book indexes, page numbers, running chapter headings, eye glasses, pencils and pens, bibliographic management applications, etc. Why not use the computing features of a computer?
Important! The results of this investigation do not return truth. Instead measurements and observations are returned which are expected to be followed up with close reading. To this end, all of the sentences returned from the original search results can be pointed to in their original documents.
Similarly, the results are intended to be jumping off points for dicussion. For example, if I were to ask you "What is intelligence?", then you would say a few things, and somebody else would say a few more things, but this process affords you a larger vocabulary for discussion. You can use the results to "riff" off the original question.
So, what is intelligence? Read the results above and discuss.
For extra credit I could apply the same process to works of epistemology, and then compare and contrast. For example, what do Plato, Aquinas, Locke, Hegel, Kant, etc. have to say on topic of intelligence. Then ask yourself, "If I were to use traditional reading technques to accomplish this task, then how long would it take me?"
If LLMs were not created with copyrighted materials, or, if LLMs were created with copyrighted materials, but access to the LLMs was limited only to authorized persons, then do you think the library community would be more amenable to their use?
Generative-AI kinda sorta works like this:
amass a set of documents
parse the documents into sentence-like chunks
create a document/term matrix ("vectorize") of all the sentences
save the sentence/vector combinations in a database
garner a query
vectorize the query
compute the similariaties ("distances") between the vectorized query and each of the stored vectors
return the N most similar sentences
done
The problem the library community seems to have is with Step #3, which is often called "embedding" and is done by things called "embedders". These embedders are representations of their original documents. They, in and of themselves, are sets of vectors describing the distances between documents. (Think "Markov models", only on steroids.) In order to create these embedders, both a whole lot of content and computing horsepower are necessary; a huge amount of linear algebra needs to be computed agaist a huge amount of sentences in order identify useful distance measures. Many, if not most, of these embedders were created from content harvested from the Web. Alas?
Now suppose the library community were to create one or more of their own embedders? Suppose the content came from things like Project Gutenberg, the HathiTrust, open access journal articles, public domain government documentss, etc? Suppose the process of vectorizing -- the creation a document/term matrixes -- was done with something as simple as
Scikit Learn's CountVectorizer. The generative-AI results may not be as good as the results generated by Big Tech, but at least the facet of copyright would have been eliminated.
Suppose the copyright facet were removed from the LLM equation. Do you think the the library community would be as averse to the use of generative-AI? If not, then I assert the aversion is not necessarily copyright but something else, and if so, then what? Put another way, besides copyright, what aversions to the use of generatie-AI does the library community seem to have? Environmentaly unfriendly? Too easy? Requires additional information literacy skills? Professionally threatening? Fear of change? Minimal understanding of how generative-AI works?
Don't get me wrong. I have not been drinking any Kool-Aid, and that said, I don't understand what the problem is. To me the use of LLMs is merely another tool in my library toolbox.
The Greater Vancouver Board of Trade invited me to do a fireside chat with Snotty Nose Rez Kids for their EDI Forum. Snotty Nose Rez Kids are an Indigenous hip hop duo who have won so many awards. Darren Metz and Quinton Nyce were so real and generous. Our conversation hit a lot of topics including Indigenous futures, matriarchs, what they mean about being a good ancestor and how they work together. They’re incredible artists and leaders.
They model being unapologetic and bold in a way that creates more space for all of us to take up space being more of ourselves.
Two of the things that they said stuck with me: First, “We’re not just making records, we’re making history”. Second, “It’s not about how far we’ve come, it’s about how far we can go.”
Snotty Nose Rez Kids are on tour across North America. Go and see them perform!
In January for a Daily Mail article, Miriam Kuepper interviewed Salomé Balthus a "high-end escort and author from Berlin" who works the World Economic Forum. Balthus reported attitudes that clarify why "3C Here We Come" is more likely. The article's full title is:
What the global elite reveal to Davos sex workers: High-class escort spills the beans on what happens behind closed doors - and how wealthy 'know the world is doomed, so may as well go out with a bang'
Below the fold I look into a wide range of evidence that Balthus' clients were telling her the truth.
Kuepper quotes Balthus:
'The elephant in the room is climate change. Everyone knows it can't be prevented any more,' she said, adding that the 'super rich' could generally be split into two groups on the topic.
'The one group thinks it only affects the poor, the "not-white race", while the others fear that it could get worse but there's no sense in trying to do anything about it so they just enjoy themselves,' she told MailOnline.
'The one half is in despair and the other, dumber, half is celebrating future mass deaths.
Salome elaborated that some of the uber wealthy people fitting into the first group were saying that those in third world countries 'might all die but us in the North, we're fine'.
She said: 'They say that in a democracy you have to sell it, to lie to people and tell them "we didn't know better and didn't think it would get this bad", not admitting that they know.
'Then there's the other group that thinks it might not be so easy, maybe it will also affect us due to unforeseeable chain reactions.
'But they say they can't do anything against the others so they live following the mantra "after us, the deluge".
'They say they will enjoy a few more nice years on earth and know that there's no future. They are very cynical and somehow deeply sad.'
This attitude matches Schmidt's fatalism — we're doomed but we might as well make money/have fun until then. What it misses is that everything they're doing is bringing "until then" closer. As I wrote about Schmidt:
He is right that “we’re not going to hit the climate goals anyway", but that is partly his fault. Even assuming that he's right and AI is capable of magically "solving the problem", the magic solution won't be in place until long after 2027, which is when at the current rate we will pass 1.5C. And everything that the tech giants are doing right now is moving the 1.5C date closer.
Economic models have systematically underestimated how global heating will affect people’s wealth, according to a new study that finds 4C warming will make the average person 40% poorer – an almost four-fold increase on some estimates.
The reason for the underestimation is that their model of the effect of climate change on a country's GDP accounts only for in-country effects. Reconsidering the macroeconomic damage of severe warming by Timothy Neal et al from the University of New South Wales instead models global weather's effects on a world of interconnected supply chains:
Figure 1 shows the projected percentage reduction in global GDP from a high emissions future (SSP5-8.5) relative to a lower emissions future (SSP1-2.6), for the three models outlined in section 2.2. Each economic model is run with and without global weather to determine its impact on the projections. Without the inclusion of global weather (blue line), all three models project more mild economic losses with a median loss at 2100 of −28% for the Burke15 model, −4% for the Kahn21 model, and −11% for the Kotz24 model. Projected losses from the latter two models are more optimistic than in the original articles, likely due to the variations in data and exact assumptions made.
The study by Australian scientists suggests average per person GDP across the globe will be reduced by 16% even if warming is kept to 2C above pre-industrial levels. This is a much greater reduction than previous estimates, which found the reduction would be 1.4%.
Today, the wealthiest middle-aged and older adults in the U.S. have roughly the same likelihood of dying over a 12-year period as the poorest adults in northern and western Europe, according to a study published Wednesday in The New England Journal of Medicine.
Heat waves, wildfires, floods, tropical storms and hurricanes are all increasing in scale, frequency and intensity, and the World Health Organization forecasts that climate change will cause 250,000 additional deaths each year by the end of this decade from undernutrition, malaria, diarrhea and heat stress alone. Even so, the impact on human health and the body count attributed to extreme weather remain massively underreported — resulting in a damaging feedback loop of policy inaction. Meanwhile, the very people who might fix that problem, at least in the US, are being fired en masse amid the Trump administration’s war on science.
But we know countries aren't going to "hit short-term and long-term climate targets" because, among other reasons, it would prevent us achieving the wonderful benefits of AI such as generated images in the style of Studio Ghibli.
Owing to “recent setbacks to global decarbonization efforts,” Morgan Stanley analysts wrote in a research report last month, they “now expect a 3°C world.” The “baseline” scenario that JP Morgan Chase uses to assess its own transition risk—essentially, the economic impact that decarbonization could have on its high-carbon investments—similarly “assumes that no additional emissions reduction policies are implemented by governments” and that the world could reach “3°C or more of warming” by 2100. The Climate Realism Initiative launched on Monday by the Council on Foreign Relations similarly presumes that the world is likely on track to warm on average by three degrees or more this century. The essay announcing the initiative calls the prospect of reaching net-zero global emissions by 2050 “utterly implausible.”
...
Bleak as warming projections are, a planet where governments and businesses fight to the death for their own profitable share of a hotter, more chaotic planet is bleaker still. The only thing worse than a right wing that doesn’t take climate change seriously might be one that does, and can muster support from both sides of the aisle to put “America First” in a warming, warring world.
Of course, we might as well "enjoy a few more nice years on earth", because the 70-year-old Schmidt (and I) will be dead long before 2100. Our grandchildren will just have to figure something out. In the meantime we need to make as much money as possible so the grandchildren can afford their bunkers.
Lets look at some of the actions of the global elite instead of the words they use when not talking to their escorts, starting with Nvidia the picks and shovels provider to the AI boom.
Nvidia's path forward is clear: its compute platforms are only going to get bigger, denser, hotter and more power hungry from here on out. As a calorie deprived Huang put it during his press Q&A last week, the practical limit for a rack is however much power you can feed it.
"A datacenter is now 250 megawatts. That's kind of the limit per rack. I think the rest of it is just details," Huang said. "If you said that a datacenter is a gigawatt, and I would say a gigawatt per rack sounds like a good limit."
The NVL72 is a rackscale design inspired heavily by the hyperscalers with DC bus bars, power sleds, and networking out the front. And at 120kW of liquid cooled compute, deploying more than a few of these things in existing facilities gets problematic in a hurry. And this is only going to get even more difficult once Nvidia's 600kW monster racks make their debut in late 2027.
This is where those "AI factories" Huang keeps rattling on about come into play — purpose built datacenters designed in collaboration with partners like Schneider Electric to cope with the power and thermal demands of AI.
So Nvidia plans to increase the power draw per rack by 10x. The funds to build the "AI factories" to house them are being raised right now as David Gerard reports in a16z raising fresh $20b to keep the AI bubble pumping:
Venture capital firm Andreessen Horowitz, affectionately known as a16z, is looking for investors to put a fresh $20 billion into AI startups. [Reuters]
For perspective, that’s more than all US venture capital funding in the first three months of 2025, which was $17 billion. [PitchBook]
This means that a16z think there’s at least this much money sloshing about, sufficiently desperate for a return.
PitchBook says a16z is talking up its links to the Trump administration to try to recruit investors — the pitch is to get on the inside of the trading! This may imply a less than robustly and strictly rule-of-law investment environment.
The owners of a recently demolished coal-fired power plant announced the site will become a data center powered by the largest natural gas plant in the country.
The Homer City Generating Station in Indiana County was decommissioned in 2023 and parts of it were imploded last month. It had been at one time the largest coal-fired power plant in Pennsylvania.
The plant’s owners, Homer City Redevelopment, announced the site will become a 3,200-acre data center campus for artificial intelligence and other computing needs
The "largest natural gas plant in the country" will be pumping out carbon dioxide for its predicted service life of 75 years, into the 3C period of 2100.
Taken together, the measures represent a sweeping attempt to ensure coal remains part of the US electricity mix, despite its higher greenhouse gas emissions and frequently greater cost when compared to natural gas or solar power.
The effort also underscores Trump’s commitment to tapping America’s coal resources as a source of both electricity to run data centers and heat to forge steel. The president and administration officials have made clear boosting coal-fired power is a priority, one they see as intertwined with national security and the US standing in a global competition to dominate the artificial intelligence industry.

Amazon, Microsoft and Google are operating data centres that use vast amounts of water in some of the world’s driest areas and are building many more, an investigation by SourceMaterial and The Guardian has found.
With US President Donald Trump pledging to support them, the three technology giants are planning hundreds of data centres in the US and across the globe, with a potentially huge impact on populations already living with water scarcity.
“The question of water is going to become crucial,” said Lorena Jaume-Palasí, founder of The Ethical Tech Society. “Resilience from a resource perspective is going to be very difficult for those communities.”
Efforts by Amazon, the world’s biggest online retailer, to mitigate its water use have sparked opposition from inside the company, SourceMaterial’s investigation found, with one of its own sustainability experts warning that its plans are “not ethical”.
Amazon’s three proposed data centres in Aragon, northern Spain—each next to an existing Amazon data centre—are licensed to use an estimated 755,720 cubic metres of water a year, enough to irrigate more than 200 hectares (500 acres) of corn, one of the region’s main crops.
In practice, the water usage will be even higher as that figure doesn’t take into account water used in generating electricity to power the new installations, said Aaron Wemhoff, an energy efficiency specialist at Villanova University in Pennsylvania.
Between them, Amazon’s planned Aragon data centres will use more electricity than the entire region currently consumes. Meanwhile, Amazon in December asked the regional government for permission to increase water consumption at its three existing data centres by 48 per cent.
Opponents have accused the company of being undemocratic by trying to rush through its application over the Christmas period. More water is needed because “climate change will lead to an increase in global temperatures and the frequency of extreme weather events, including heat waves”, Amazon wrote in its application.
Right. We need to use more water to cope with the "extreme weather events, including heat waves" we are causing, which will allow us to cause more "extreme weather events" which will mean we need more water! It is a vicious cycle.
Is there really a demand for these monsters? One of Nvidia's big customers is CoreWeave:
In my years writing this newsletter I have come across few companies as rotten as CoreWeave — an "AI cloud provider" that sells GPU compute to AI companies looking to run or train their models.
CoreWeave had intended to go public last week, with an initial valuation of $35bn. While it’s hardly a recognizable name — like, say, OpenAI, or Microsoft, or Nvidia — this company is worth observing, if not for the fact that it’s arguably the first major IPO that we’ve seen from the current generative AI hype bubble, and undoubtedly the biggest.
The initial public offering of AI infrastructure firm CoreWeave, initially targeting a $2.7bn raise at $47-55 per share, was slashed to $1.5bn at $40 per share. Even then, the deal barely limped across the finish line, thanks to a last-minute $250mn “anchor” order from Nvidia. The offering reportedly ended up with just three investors holding 50 per cent of the stock, and it seems to have required some stabilisation from lead bank Morgan Stanley to avoid a first-day drop. Hardly a textbook success.
Imagine a caravan maker. It sells caravans to a caravan park that only buys one type of caravan. The caravan park leases much of its land from another caravan park. The first caravan park has two big customers. One of the big customers is the caravan maker. The other big customer is the caravan maker’s biggest customer. The biggest customer of the second caravan park is the first caravan park.
This, more or less, is the line being taken by AI researchers in a recent survey. Asked whether "scaling up" current AI approaches could lead to achieving artificial general intelligence (AGI), or a general purpose AI that matches or surpasses human cognition, an overwhelming 76 percent of respondents said it was "unlikely" or "very unlikely" to succeed.
"The vast investments in scaling, unaccompanied by any comparable efforts to understand what was going on, always seemed to me to be misplaced," Stuart Russel, a computer scientist at UC Berkeley who helped organize the report, told NewScientist. "I think that, about a year ago, it started to become obvious to everyone that the benefits of scaling in the conventional sense had plateaued."
AI continues to improve – at least according to benchmarks. But the promised benefits have largely yet to materialize while models are increasing in size and becoming more computationally demanding, and greenhouse gas emissions from AI training continue to rise.
These are some of the takeaways from the AI Index Report 2025 [PDF], a lengthy and in-depth publication from Stanford University's Institute for Human-Centered AI (HAI) that covers development, investment, adoption, governance and even global attitudes towards artificial intelligence, giving a snapshot of the current state of play.
...
However, HAI highlights the enormous level of investment still being pumped into the sector, with global corporate AI investment reaching $252.3 billion in 2024, up 26 percent for the year. Most of this is in the US, which hit $109.1 billion, nearly 12 times higher than China's $9.3 billion and 24 times the UK's $4.5 billion, it says.
Despite all this investment, "most companies that report financial impacts from using AI within a business function estimate the benefits as being at low levels," the report writes.
It says that 49 percent of organizations using AI in service operations reported cost savings, followed by supply chain management (43 percent) and software engineering (41 percent), but in most cases, the cost savings are less than 10 percent.
When it comes to revenue gains, 71 percent of respondents using AI in marketing and sales reported gains, while 63 percent in supply chain management and 57 percent in service operations, but the most common level of revenue increase is less than 5 percent.
Meanwhile, despite the modest returns, the HAI report warns that the amount of compute used to train top-notch AI models is doubling approximately every 5 months, the size of datasets required for LLM training is doubling every eight months, and the energy consumed for training is doubling annually.
This is leading to rapidly increasing greenhouse gas emissions resulting from AI training, the report finds. It says that early AI models such as AlexNet over a decade ago caused only modest CO₂ emissions of 0.01 tons, while GPT-4 (2023) was responsible for emitting 5,184 tons, and Llama 3.1 405B (2024) pumping out 8,930 tons. This compares with about 18 tons of carbon a year the average American emits, it claims.
The premise that AI could be indefinitely improved by scaling was always on shaky ground. Case in point, the tech sector's recent existential crisis precipitated by the Chinese startup DeepSeek, whose AI model could go toe-to-toe with the West's flagship, multibillion-dollar chatbots at purportedly a fraction of the training cost and power.
Of course, the writing had been on the wall before that. In November last year, reports indicated that OpenAI researchers discovered that the upcoming version of its GPT large language model displayed significantly less improvement, and in some cases, no improvements at all than previous versions did over their predecessors.
According to OpenAI’s internal tests, o3 and o4-mini, which are so-called reasoning models, hallucinate more often than the company’s previous reasoning models — o1, o1-mini, and o3-mini — as well as OpenAI’s traditional, “non-reasoning” models, such as GPT-4o.
Perhaps more concerning, the ChatGPT maker doesn’t really know why it’s happening.
In its technical report for o3 and o4-mini, OpenAI writes that “more research is needed” to understand why hallucinations are getting worse as it scales up reasoning models. O3 and o4-mini perform better in some areas, including tasks related to coding and math. But because they “make more claims overall,” they’re often led to make “more accurate claims as well as more inaccurate/hallucinated claims,” per the report.
OpenAI found that o3 hallucinated in response to 33% of questions on PersonQA, the company’s in-house benchmark for measuring the accuracy of a model’s knowledge about people. That’s roughly double the hallucination rate of OpenAI’s previous reasoning models, o1 and o3-mini, which scored 16% and 14.8%, respectively. O4-mini did even worse on PersonQA — hallucinating 48% of the time.
It may well turn out that people put more value on being right than being plausible.
Increasingly, there are other signs that the current, costly, proprietary AI approach is coming to an end. For example, we have Matt Asay's DeepSeek’s open source movement:
It’s increasingly common in AI circles to refer to the “DeepSeek moment,” but calling it a moment fundamentally misunderstands its significance. DeepSeek didn’t just have a moment. It’s now very much a movement, one that will frustrate all efforts to contain it. DeepSeek, and the open source AI ecosystem surrounding it, has rapidly evolved from a brief snapshot of technological brilliance into something much bigger—and much harder to stop. Tens of thousands of developers, from seasoned researchers to passionate hobbyists, are now working on enhancing, tuning, and extending these open source models in ways no centralized entity could manage alone.
For example, it’s perhaps not surprising that Hugging Face is actively attempting to reverse engineer and publicly disseminate DeepSeek’s R1 model. Hugging Face, while important, is just one company, just one platform. But Hugging Face has attracted hundreds of thousands of developers who actively contribute to, adapt, and build on open source models, driving AI innovation at a speed and scale unmatched even by the most agile corporate labs.
Now, researchers at Microsoft's General Artificial Intelligence group have released a new neural network model that works with just three distinct weight values: -1, 0, or 1. Building on top of previous work Microsoft Research published in 2023, the new model's "ternary" architecture reduces overall complexity and "substantial advantages in computational efficiency," the researchers write, allowing it to run effectively on a simple desktop CPU. And despite the massive reduction in weight precision, the researchers claim that the model "can achieve performance comparable to leading open-weight, full-precision models of similar size across a wide range of tasks."
ChatGPT came out in 2022, and the Chinese government declared AI infrastructure a national priority. Over 500 new data centres were announced in 2023 and 2024. Private investors went all-in.
Demand for the data centres turns out not to be there. Around 80% are not actually in use. [MIT Technology Review]
The business model was to rent GPUs. DeepSeek knifed that, much as it did OpenAI. There’s now a lot of cheap GPU in China. Data centre projects are having trouble finding new investment.
The Chinese data centre boom was a real estate deal — many investors pivoted straight from real estate to AI.
Having lived through the early days of the internet frenzy, Fabrice Coquio, senior veep at Digital Realty, which bills itself as the world's largest provider of cloud and carrier-neutral datacenter, colocation and interconnection services, is perhaps better placed than most to venture an opinion. Is there a bubble?
"I have been in this industry for 25 years, so I've seen some ups and downs. At the moment, definitely that's on the very bullish side, particularly because of what people believe will be required for AI," he tells The Register.
Grabbing a box of Kleenex tissues, he quips that back at the turn of the millennium, if investors were told the internet was inside they would have rushed to buy it. "Today I am telling you there is AI inside. So buy it."
"Is there a bubble? Potentially? I see the risk, because when some of the traditional investments in real estate – like housing, logistics and so on – are not that important, people are looking to invest their amazing capacity of available funds in new segments, and they say, 'Oh, why not datacenters?'"
He adds: "In the UK, in France, in Germany, you've got people coming from nowhere having no experiences… that have no idea about what AI and datacenters are really and still investing in them.
"It's the expression of a typical bubble. At the same time, is the driver of AI a big thing? Yes… [with] AI [there] is a sense of incredible productivity for companies and then for individuals. And this might change drastically the way we work, we operate, and we deliver something in a more efficient way.
The "slow AIs" that run the major AI companies hallucinated a future where scaling continued to work and have already sunk vast sums into data centers. The "slow AIs" can't be wrong:
Nonetheless, if Microsoft's commitment to still spending tens of billions of dollars on data centers is any indication, brute force scaling is still going to be the favored MO for the titans of the industry — while it'll be left to the scrappier startups to scrounge for ways to do more with less.
The IEA’s models project that data centres will use 945 terawatt-hours (TWh) in 2030, roughly equivalent to the current annual electricity consumption of Japan. By comparison, data centres consumed 415 TWh in 2024, roughly 1.5% of the world’s total electricity consumption (see ‘Global electricity growth’).
The projections focus mostly on data centres in general, which also run computing tasks other than AI — although the agency estimated the proportion of data-centre servers devoted to AI. They found that such servers accounted for 24% of server electricity demand and 15% of total data-centre energy demand in 2024.
Alex de Vries, a researcher at the Free University of Amsterdam and the founder of Digiconomist, who was not involved with the report, thinks this is an underestimate. The report “is a bit vague when it comes to AI specifically”, he says.
Even with these uncertainties, “we should be mindful about how much energy is ultimately being consumed by all these data centres”, says de Vries. “Regardless of the exact number, we’re talking several percentage of our global electricity consumption.”
There are reasonable arguments to suggest that AI tools may eventually help reduce emissions, as the IEA report underscores. But what we know for sure is that they’re driving up energy demand and emissions today—especially in the regional pockets where data centers are clustering.
So far, these facilities, which generally run around the clock, are substantially powered through natural-gas turbines, which produce significant levels of planet-warming emissions. Electricity demands are rising so fast that developers are proposing to build new gas plants and convert retired coal plants to supply the buzzy industry.
If the data centers get built, they will add to carbon emissions and push us closer to 3C sooner. Of course, this investment in data centers needs to generate a return, but it may well turn out that the market isn't willing to pay enough for Ghibli-style memes to provide it. Ed Zitron has been hammering away at this point, for example in There Is No AI Revolution:
Putting aside the hype and bluster, OpenAI — as with all generative AI model developers — loses money on every single prompt and output. Its products do not scale like traditional software, in that the more users it gets, the more expensive its services are to run because its models are so compute-intensive.
For example, ChatGPT having 400 million weekly active users is not the same thing as a traditional app like Instagram or Facebook having that many users. The cost of serving a regular user of an app like Instagram is significantly smaller, because these are, effectively, websites with connecting APIs, images, videos and user interactions. These platforms aren’t innately compute-heavy, at least to the same extent as generative AI, and so you don’t require the same level of infrastructure to support the same amount of people.
Conversely, generative AI requires expensive-to-buy and expensive-to-run GPUs, both for inference and training the models themselves. The GPUs must be run at full tilt for both inference and training models, which shortens their lifespan, while also consuming ungodly amounts of energy. And surrounding that GPU is the rest of the computer, which is usually highly-specced, and thus, expensive.
OpenAI, as I've written before, is effectively the entire generative AI industry, with its nearest competitor being less than five percent of its 500 million weekly active users.
Source
Ed Zitron has been arguing for more than a year that OpenAI's finances simply don't make sense, and in OpenAI Is A Systemic Risk To The Tech Industry he makes the case in exquisite detail and concludes:
Even in a hysterical bubble where everybody is agreeing that this is the future, OpenAI currently requires more money and more compute than is reasonable to acquire. Nobody has ever raised as much as OpenAI needs to, and based on the sheer amount of difficulty that SoftBank is having in raising the funds to meet the lower tranche ($10bn) of its commitment, it may simply not be possible for this company to continue.
Even with extremely preferential payment terms — months-long deferred payments, for example — at some point somebody is going to need to get paid.
I will give Sam Altman credit. He's found many partners to shoulder the burden of the rotten economics of OpenAI, with Microsoft, Oracle, Crusoe and CoreWeave handling the up-front costs of building the infrastructure, SoftBank finding the investors for its monstrous round, and the tech media mostly handling his marketing for him.
He is, however, over-leveraged. OpenAI has never been forced to stand on its own two feet or focus on efficiency, and I believe the constant enabling of its ugly, nonsensical burnrate has doomed this company. OpenAI has acted like it’ll always have more money and compute, and that people will always believe its bullshit, mostly because up until recently everybody has.
OpenAI cannot "make things cheaper" at this point, because the money has always been there to make things more expensive, as has the compute to make larger language models that burn billions of dollars a year. This company is not built to reduce its footprint in any way, nor is it built for a future in which it wouldn't have access to, as I've said before, infinite resources.
Zitron uses Lehman Brothers as an analogy for the effects of a potential OpenAI failure:
I can see OpenAI’s failure having a similar systemic effect. While there is a vast difference between OpenAI’s involvement in people’s lives compared to the millions of subprime loans issued to real people, the stock market’s dependence on the value of the Magnificent 7 stocks (Apple, Microsoft, Amazon, Alphabet, NVIDIA and Tesla), and in turn the Magnificent 7’s reliance on the stability of the AI boom narrative still threatens material harm to millions of people, and that’s before the ensuing layoffs.
One hint that we might just be stuck in a hype cycle is the proliferation of what you might call “second-order slop” or “slopaganda”: a tidal wave of newsletters and X threads expressing awe at every press release and product announcement to hoover up some of that sweet, sweet advertising cash.
That AI companies are actively patronising and fanning a cottage economy of self-described educators and influencers to bring in new customers suggests the emperor has no clothes (and six fingers).
There are an awful lot of AI newsletters out there, but the two which kept appearing in my X ads were Superhuman AI run by Zain Kahn, and Rowan Cheung’s The Rundown. Both claim to have more than a million subscribers — an impressive figure, given the FT as of February had 1.6mn subscribers across its newsletters.
If you actually read the AI newsletters, it becomes harder to see why anyone’s staying signed up. They offer a simulacrum of tech reporting, with deeper insights or scepticism stripped out and replaced with techno-euphoria. Often they resemble the kind of press release summaries ChatGPT could have written.
Yet AI companies apparently see enough upside to put money into these endeavours. In a 2023 interview, Zayn claimed that advertising spots on Superhuman pull in “six figures a month”. It currently costs $1,899 for a 150-character write-up as a featured tool in the newsletter.
...
“These are basically content slop on the internet and adding very little upside on content value,” a data scientist at one of the Magnificent Seven told me. “It’s a new version of the Indian ‘news’ regurgitation portals which have gamified the SEO and SEM [search engine optimisation and marketing] playbook.”
But newsletters are only the cream of the crop of slopaganda. X now teems with AI influencers willing to promote AI products for minimal sums (the lowest pricing I got was $40 a retweet). Most appear to be from Bangladesh or India, with a smattering of accounts claiming to be based in Australia or Europe. In apparent contravention of X’s paid partnerships policy, none disclose when they’re getting paid to promote content.
...
In its own way, slopaganda exposes that the AI’s emblem is not the Shoggoth but the Ouroboros. It’s a circle of AI firms, VCs backing those firms, talking shops made up of employees of those firms, and the long tail is the hangers-on, content creators, newsletter writers and ‘marketing experts’ willing to say anything for cash.
The AI bubble bursting would be a whole different and much quicker "going out with a bang". How likely is it? To some extent OpenAI is just a front for Microsoft, which gets a slice of OpenAI's revenue, has access to OpenAI's technology, "owns" a slice of the "non-profit", and provides almost all of OpenAI's compute at discounted prices. Microsoft, therefore, has perhaps the best view of the generative AI industry and its prospects.
In February, stock analysts TD Cowen spotted that Microsoft had cancelled leases for new data centres — 200 megawatts in the US, and one gigawatt of planned leases around the world.
Microsoft denied everything. But TD Cowen kept investigating and found another two gigawatts of cancelled leases in the US and Europe. [Bloomberg, archive]
Bloomberg has now confirmed that Microsoft has halted new data centres in Indonesia, the UK, Australia and the US. [Bloomberg, archive]
The Cambridge, UK site was specifically designed to host Nvidia GPU clusters. Microsoft also pulled out of the new Docklands Data Centre in Canary Wharf, London.
In Wisconsin, US, Microsoft had already spent $262 million on construction — but then just pulled the plug.
Mustafa Suleyman of Microsoft told CNBC that instead of being “the absolute frontier,” Microsoft now prefers AI models that are “three to six months behind.” [CNBC]
Google has taken up some of Microsoft’s abandoned deals in Europe. OpenAI took over Microsoft’s contract with CoreWeave. [Reuters]
Ed Zitron covered this "pullback" a month ago in Power Cut:
As a result, based on TD Cowen's analysis, Microsoft has, through a combination of canceled leases, pullbacks on Statements of Qualifications, cancellations of land parcels and deliberate expiration of Letters of Intent, effectively abandoned data center expansion equivalent to over 14% of its current capacity.
...
In plain English, Microsoft, which arguably has more data than anybody else about the health of the generative AI industry and its potential for growth, has decided that it needs to dramatically slow down its expansion. Expansion which, to hammer the point home, is absolutely necessary for generative AI to continue evolving and expanding.
While there is a pullback in Microsoft's data center leasing, it’s seen a "commensurate rise in demand from Oracle related to The Stargate Project" — a relatively new partnership of "up to $500 billion" to build massive new data centers for AI, led by SoftBank, and OpenAI, with investment from Oracle and MGX, a $100 billion investment fund backed by the United Arab Emirates.
The data centers will get built, and they will consume power, because even if AI never manages to turn a profit, some other bubble will take its place to use all the idle GPUs. Despite all the rhetoric about renewables and small modular reactors, much of the additional power will come from fossil fuels.
Data center carbon emissions don't just come from power (Scope 1 and 2). In 2023 Jialin Lyu et al from Microsoft published Myths and Misconceptions Around Reducing Carbon Embedded in Cloud Platforms and stressed the importance of embedded carbon (Scope 3) in the total environmental impact of data centers:
For example, 66% of the electricity used at Google datacenters was matched with renewable energy on an hourly basis in 2021. With historic growth rates, this is likely closer to 70% today. Our LCAs indicate that with 70-75% renewable energy, Scope 3 accounts for close to half of datacenter carbon emissions. Therefore, Scope 3 emissions and embodied carbon are important factors both currently and in the near future.
The Redmond IT giant says that its CO2 emissions are up 29.1 percent from the 2020 baseline, and this is largely due to indirect emissions (Scope 3) from the construction and provisioning of more datacenters to meet customer demand for cloud services.
These figures come from Microsoft's 2024 Environmental Sustainability Report [PDF], which covers the corp's FY2023 ended June 30, 2023. This encompasses a period when Microsoft started ramping up AI support following the explosion of interest in OpenAI and ChatGPT.
Microsoft's "pullback" will likely reduce their Scope 3 emissions going forward, but I would expect that their recent build-out will have reduced the proportion of renewables being consumed. If the Stargate build-out goes ahead it will cause enormous Scope 3 emissions.
Here is one final note of gloom. Training AI models requires rapid access to large amounts of data, motivating data centers to use SSDs instead of hard drives. Counterintuitively, research Seagate published in Decarbonizing Data shows that, despite their smaller size, SSDs have much higher embedded carbon emissions than hard drives. 30TB of SSD has over 160 times as much embedded carbon as a 30TB hard drive.
Even more of a suprise, Seagate's research shows that SSDs even have higher operational emissions than hard drives. While actively reading or writing data, a 30TB SSD uses twice as much power as a 30TB hard drive.
The legacy of Balthus' clients attitude that they 'know the world is doomed, so may as well go out with a bang' and the unsustainable AI bubble will be a massive overbuild of data centers, most of which will be incapable of hosting Nvidia's top-of-the-line racks. If the current cryptocurrency-friendly administration succeeds in pumping Bitcoin back these data centers will likely revert to mining. Either way, the Scope 3 emissions from building and equipping and the Scope 1 and 2 emissions from powering them with natural gas and coal, will put megatons of CO2 into the atmosphere, hastening the point where it is unlikely that 'us in the North, we're fine'.
One of my work highlights this year has been co-designing a series of five workshops to teach coaching skills to open scientists. Open scientists from NASA, NOAA Fisheries, The California Environmental Protection Agency, Fred Hutch Cancer Center participated in these workshops organized by Openscapes.
Starting a systems librarian role after a prolonged vacancy presents a distinct set of challenges and opportunities. This reflective column explores the experience of navigating the first year in such a position, emphasizing the importance of learning through action, relationship-building, and adaptive leadership. From mastering core systems to establishing connections across campus IT and internal library departments, the column highlights strategies for building credibility and trust while supporting critical library services. It also examines the transition from technical contributor to departmental leader, illustrating how systems librarians increasingly engage in strategic planning, policy development, and organizational change. This column offers practical insights for new systems librarians stepping into evolving roles at the intersection of technology, user experience, and institutional priorities.
In 2024, Hamilton College started a project to pilot Archivematica, a digital preservation platform. The author details leading the project as the relatively new Digital Curation and Preservation Librarian and suggests ways that readers could approach such a project, incorporating what she learned along the way.
This reflective piece chronicles the first year of establishing a Virtual Reality (VR) program at the Paul Sawyier Public Library in Frankfort, Kentucky. Beginning with limited VR experience and a modest budget, the author navigated the challenges of launching the initiative—from equipment procurement and account management to program development and community engagement. The library introduced VR experiences aimed at enhancing digital literacy, education, and recreation for diverse age groups, achieving notable success with programs such as Anne Frank House VR and Maestro VR. Lessons learned included the importance of thorough preparation, selecting age-appropriate content, embracing community feedback, and adapting programming to audience needs. Despite early obstacles, the VR initiative attracted over 50 participants in its first year, demonstrating the community’s readiness for emerging technologies. Building on this momentum, the library plans to expand its VR offerings, cementing virtual reality as an innovative and inclusive tool for lifelong learning and engagement in a rural setting.
This paper examines the integration of retrieval-augmented generation (RAG) systems within academic library environments, focusing on their potential to transform traditional search and retrieval mechanisms. RAG combines the natural language understanding capabilities of large language models with structured retrieval from verified knowledge bases, offering a novel approach to academic information discovery. The study analyzes the technical requirements for implementing RAG in library systems, including embedding pipelines, vector databases, and middleware architecture for integration with existing library infrastructure. We explore how RAG systems can enhance search precision through semantic indexing, real-time query processing, and contextual understanding while maintaining compliance with data privacy and copyright regulations. The research highlights RAG’s ability to improve user experience through personalized research assistance, conversational interfaces, and multimodal content integration. Critical considerations including ethical implications, copyright compliance, and system transparency are addressed. Our findings indicate that while RAG presents significant opportunities for advancing academic library services, successful implementation requires careful attention to technical architecture, data protection, and user trust. The study concludes that RAG integration holds promise for revolutionizing academic library services while emphasizing the need for continued research in areas of scalability, ethical compliance, and cost-effective implementation.
Current metadata creation for web archives is time consuming and costly due to reliance on human effort. This paper explores the use of GPT-4o for metadata generation within the Web Archive Singapore, focusing on scalability, efficiency, and cost effectiveness. We processed 112 Web ARChive (WARC) files using data reduction techniques, achieving a notable 99.9% reduction in metadata generation costs. By prompt engineering, we generated titles and abstracts, which were evaluated both intrinsically using Levenshtein distance and BERTScore, and extrinsically with human cataloguers using McNemar’s test. Results indicate that while our method offers significant cost savings and efficiency gains, human curated metadata maintains an edge in quality. The study identifies key challenges including content inaccuracies, hallucinations, and translation issues, suggesting that large language models (LLMs) should serve as complements rather than replacements for human cataloguers. Future work will focus on refining prompts, improving content filtering, and addressing privacy concerns through experimentation with smaller models. This research advances the integration of LLMs in web archiving, offering valuable insights into their current capabilities and outlining directions for future enhancements. The code is available at https://github.com/masamune-prog/warc2summary for further development and use by institutions facing similar challenges.
Bibliographic ontologies are crucial to make the most of networked library metadata, but they show interoperability limitations in the Semantic Web. Following a research study on the subject, this paper presents a possible solution to such limitations by means of a reference ontology (RO) intended to allow integration of different ontologies without imposing a common central one and to overcome limitations of mapping techniques, such as crosswalks and application profiles, most used in interconnecting bibliographic ontologies. Interoperability issues of Resource Description and Access (RDA) and Bibliographic Framework Initiative—BIBFRAME (BF) ontologies are addressed using real-world examples from the Library of Congress (LoC) and Biblioteca Nacional de España (BNE) datasets. For a proof of concept of the RO, this paper is focused on two specific interoperability problems that are not solvable with the usual data transformative techniques: misalignments concerning the definition and representation of Work and Expression classes; and the absence of formalization of properties essential to whole-part relationships, namely transitivity, nonreflexivity and asymmetry. The potential of the RO for solving such problem examples is demonstrated by making in-depth use of Resource Description Framework Schema/Web Ontology Language (RDFS/OWL) semantic reasoning and inference mechanisms, combined with Shapes Constraint Language (SHACL), when restrictions are needed to impose data constraints and validation. The RO innovation consists in the formulation of an independent high-level ontology, through which the elements of different source-ontologies are interlinked without being modified or replaced, but rather preserved, and in using semantic mechanisms to generate additional elements needed to consistently describe the relationship between them.
Over the past fifteen years, most academic librarians have implemented one-stop search tools, commonly referred to as discovery layers, to accommodate contemporary user expectations. In more recent years these tools have come under criticism due to their limitations and shortcomings. We set out to evaluate if a discovery layer, when prompted with typical user keyword search strings, produced the most relevant search results when compared with two other widely accessible academic search tools. We compared search results from a discovery layer with a central index (WorldCat Discovery) with search results from a subscription interdisciplinary index and abstract database (Academic Search Complete) and a freely accessible academic web search engine (Google Scholar). We created a rubric detailed enough for multiple evaluators, who were the authors, to judge search results for currency, relevancy, proximity, and authority, as well as to assign appropriate penalties. Academic Search Complete search results received the highest overall scores, while WorldCat Discovery search results received the lowest overall scores. When considering individual pieces of the rubric, Academic Search Complete provided the most current and authoritative sources, while Google Scholar provided the most relevant sources. This article provides recommendations for libraries moving forward to consider the benefits and costs of discovery tools.
Content delivery mechanisms in web-scale discovery services can often fall short of patron expectations. The Texas Tech University Libraries integrated Third Iron’s LibKey Discovery with Ex Libris Primo in response to patron feedback that accessing full-text articles from Primo required too many clicks. Following implementation, researchers conducted user testing to assess the usability and usefulness of the integration. They also analyzed LibKey Discovery and link resolver usage data across the year following the launch to evaluate its impact on how patrons accessed full-text articles. Patrons responded positively overall to LibKey Discovery, perceiving it as more efficient and quicker to use. Statistics showed an increase in LibKey link usage and a corresponding decrease in link resolver clickthroughs. This article provides an overview of the implementation process, describes assessment methodologies and findings, and discusses implications for improving usability and increasing usage.
Lack of expertise, among other reasons, has been cited as the reason for Nigerian libraries’ sluggish adoption and application of innovative technology. To solve this problem, a thorough analysis of the level of technology implementation in Nigerian libraries is needed. This work closes the gap in the literature by using the PRISMA search method to examine 42 pertinent works published between 2016 and 2023. A questionnaire was used to collect data from 240 respondents using the survey approach. Six federal university libraries were selected by a stratified random sampling procedure, one from each of Nigeria’s six geopolitical zones. Then, 40 library employees from each of the selected libraries were selected using a purposive sample technique. Mean and standard deviation were used to analyze the responses. The results demonstrate a grand mean of 2.44 (SD=1.15), indicating low staff awareness of the potential benefits of innovative technology for library operations. A negative grand mean of 2.42 on the degree of usage was also noted, indicating low use of cutting-edge technology in the research area. A lack of internet penetration, a deficiency of digital literacy, insufficient funds, and unstable power sources were among the problems found limiting Nigerian libraries from taking advantage of advanced technologies. In light of this, the study suggests that the Nigerian government should increase budget allocations for libraries and enhance policies that support the self-development of library staff. Additionally, libraries in developing countries should seek mentorship from those in developed nations to update their knowledge and skills, enabling better implementation and deployment of cutting-edge technology in their libraries.
I frequently create network graphs for the purposes of analyzing and visualizing corpora of narrative text. Network graphs, at their simplest, are composed of only two things, nodes and edges, where nodes are things and edges are relationships between those things. This missive outlines a few ways I use network graphs to do distant reading against corpora.
Modeling bigrams
In my world, creating network graphs can be as simple as selectively modeling a corpus's bigrams. For example, in the Iliad and the Odyssey, I might want to know, "What are some of the things shared between Ulysses, Achilles, Hector, Penelope, and Telemachus? What do they all have on common, how are they distinctive, and to what degree are they related to each other?" To actually create the graph, one can find all bigrams, loop through each, retain only the bigrams whose first word is one of the selected characters, and save the result as a file. In my case, an abbreviated version of node combinations -- the graph -- looks like this:
hector drew
achilles cut
achilles prays
hector tore
telemachus gave
penelope he
ulysses leading
hector saw
ulysses requite
achilles cleaver
ulysses replied
hector horses
Such is called an edges table, and while the type of edges is not explicitly articulated, the simple pairing of nodes denotes some sort of relationship.
Once an edges table is created, it can be imported into any number of desktop applications or programming languages for analysis and visualization. Personally, I use an application called Gephi and/or a Python library called networkx for these purposes.
Network graphs have all sorts of different properties. For example, a graph can be directional or not, meaning if the the edges emanate from one node to another, then the graph is "directional". If not, then the graph is "bi-directional". Second, a node may have many edges, and the number of edges is called the node's "degree". If the graph is directional, then nodes have some number of "in-degrees" and some number of "out-degrees". Other properties include but are certainly not limited to: "betweenness", "closeness", and "diameter". Moreover, one might apply any number of clustering techniques to a graph to determine the size and scope of "neighborhoods". After taking a graph's properties into account, graphs can be visualized. For example, the color and sizes of things can be assigned, and different layouts can be employed. When it comes to layouts, force-directed layouts are the most popular.
After importing my graph into Gephi, taking a number of different properties into account, I generated the following visualization:
What are some of the things shared between Ulysses, Achilles, Hector, Penelope, and Telemachus? Well, for example, both Achilles and Hector are associated with "slay", "slew", "shield", and "burn". While only Penelope and Telemachus are associated with "wept", and "sends".
What do they all have on common? All the characters are associated with "he", "took", "smiled", "lay", and to the greatest degree, "answered". (Apparently Ulysses does a lot of answering!)
How are they distinctive? Only Penelope is associated with "daughter", only Telemachus is associated with "lost", etc.
To what degree are they related to each other? Because of the layout, I assert Achilles and Telemachus are not strongly associated with each other, at least not as much as Ulysses and Penelope. Furthermore, notice how Telemachus is not opposite his parents, Ulysses and Penelope.
The modeling and visualizing of texts in the manner outlined above does not convey truth. Instead, what is conveyed are measurements and observations. It it up to the student, researcher, or scholar to interpret the measurements and observations. Personally, I see violent words between Achilles and Hector. I see words of authority between Ulysses and Achilles. I see non-violent words between Penelope, Telemachus, and Ulysses. All of these observations can then lead to discussion, which is the whole point of reading, in my opinion.
Modeling bibliographics
A more concrete way to model texts as network graphs is through bibliographics. Authors write things, and the things have titles. The titles are about any number of topics, and those topics can be denoted as keywords. Given these types of nodes all sort of new questions can be addressed:
Who wrote what, and what did they write about?
Who is the most prolific author?
What are the items in the corpus about?
Across the corpus, what themes predominate?
To what degree do the items in the corpus cluster into groups, and if they do, then what are those groups?
In the case of the Iliad and the Odyssey, there are forty-eight books ("chapters"). They are all written by the same person -- Homer. Using a variation of the venerable Term-Frequency Inverse Document Frequency (TFIDF) algorithm, I can compute and associate statistically significant keywords for each chapter. In this case, I save the node combinations as a Graph Modeling Language (GML) file, which just a more expressive version of an edges table. After importing the file into Gephi, and after taking various properties into account, I can visualize the graph in the following way:
From the visualization I can assert a number of things:
The corpus is about "trojans", "achaeans", "ships", "hector", "jove", "suitors", "father", "home", etc.
After applying a clustering technique, I see the corpus falls into two distinct groups. One of the groups is the Iliad and the other is the Odyssey. And no, these groups were not generated by the names of titles but instead by their shared keywords.
Since the word "man" is pretty much in the center of the graph, I assert that "man" is common theme throughout the corpus.
As outlined above "betweenness" is a property of graphs. Nodes are denoted as having a high degree of betweenness if one has to go through them to get to other nodes. Such nodes have a certain significance. Kinda like a social network, if there a person who connects many other people, then that person is a good person to know. After calculating betweenness and removing all of the nodes with a betweenness value of zero, the following nodes remain:
I assert if one were to focus their attention on these remaining keywords and chapters, then one would be get a pretty good understanding of the corpus.
Modeling multiple authors
The Iliad and the Odyssey were written by a single person, but the process becomes much more interesting when multiple authors are combined into the same graph. Such is what I did below where I modeled the Iliad and the Odyssey (by Homer), Walden Pond (by Thoreau), and Emma (by Austen):
Homer's works (still) fall into two distinct groups.
The works of Homer and of Thoreau are more similar because they share keywords such as "house", "man", and other things to a lesser degree.
In terms of aboutness, Austen's work is not like the works of Homer nor Thoreau.
Granted, anybody familiar with the works of Homer, Thoreau, and/or Austen would say, "So what. I already know that." And my reply would be two-fold. First, "Yes, but what if you were not familiar with the works, then the illustration tell you a story and provides you with a sort of overview of the corpus." Second, "Yes, I know that but now you are equipped with a larger vocabulary for use and understanding. For example, what words are obviously understood and what words are unexpected? Discuss."
Summary
Network graphs -- collections of nodes and edges -- are a useful thinggs for the use and understanding of narrative texts. They provide the means to measure and observe the content of a corpus in ways traditional reading does not afford.
Epilouge
This essay, the edges table, the two GML files, and the Gephi file used to create the visualizations ought to be availble as a zip file at:
Figure 1: A virtual slide from Old Dominion University's GAAD 2025 event highlights "Global Accessibility Awareness Day (GAAD)" during a hybrid session on inclusive design.
Celebrating Global Accessibility Awareness Day (GAAD), Old Dominion University Libraries successfully hosted "Accessible by Design: Creating Inclusive PDFs Using Adobe Acrobat" in collaboration with the recently established Employees with Disabilities Association (EWDA). Led by Dr. Brett Cook-Snell, this hybrid workshop brought together faculty, staff, and students both in person at Perry Library Room 1306 and online via Zoom for a thorough investigation of digital accessibility that went far beyond technical training to address fundamental questions about inclusion, ableism, and universal design. I attended the session virtually via Zoom, and in this blog post, I will share my firsthand experience and reflections. Since its launch in 2021 (Figure 2), when the first event was planned as a library-only endeavor, GAAD at ODU Libraries has evolved into a ritual. It has evolved over years into a campus-wide celebration with past cooperation involving the Office of Educational Accessibility and several academic departments. The event last year, for instance, concentrated on increasing web archive accessibility; as the WS-DL blog summarizes, "Accessibility is not a one-time fix but an ongoing process that requires continuous evaluation and improvement." Reiterating ODU's dedication to creating a community of education, advocacy, and connectedness among all faculty and staff, regardless of disability status, this year's collaboration with EWDA marked yet another forward step.
Constructing Community via Cooperation and Leadership
The session began with strong reflections on the universality of disability; instead of merely explaining why accessibility matters, it aimed to demonstrate how to do the work step by step, including its challenges. As speaker, Tim Hackman, Dean of University Libraries, underlined that “We're all only temporarily able-bodied, and disability touches every family eventually, so the real question is: Will the tools we build today still welcome us tomorrow?” Head of systems development at the library Holly Kubli gave insightful background on ODU's increasing dedication to GAAD, noting that this season marked the university's fifth year commemorating the day, from a library-only project in 2021 to a campus-wide cooperative effort. Combining advocates and practitioners from all across the university to foster "a community of education, advocacy, and connectedness among faculty and staff, regardless of disability status, to address shared challenges, promote inclusivity, and enhance accessibility across the university," the collaboration with EWDA marked a notable extension of these efforts. Identifying himself as queer, bipolar, and neurodiverse while acknowledging the land of the Powhatan Confederacy and Virginia's role in historical injustices, Dr. Cook-Snell, the recently elected president of EWDA, brought both technical expertise and lived experience to the workshop. Emphasizing personal commitment to challenge university policies, his approach linked the work of accessibility to more general social justice initiatives. Emily Harmon, vice president, who Dr. Cook-Snell credited as "the brains behind this operation," and Kristen Osborne, mentoring chair, helped to ensure virtual attendees stayed fully engaged throughout the session by facilitating correspondence between in-person and online participants (Figure 3).
The workshop included a crucial instructional component on ableism and systemic barriers, which resonated with attendees before we began the technical training. From homes to businesses, grocery stores, and even family dynamics, the conversation looked at where ableism shows up in daily life. Participants offered careful examples covering the structural obstacles in education and the high cost of access tools to the planning stage when accessibility issues are sometimes disregarded. One especially poignant illustration of how inclusion calls for deliberate attention even in close quarters was a participant reminding family members to say goodbye to a nonverbal nephew. The discussion touched on several forms of ableism, including the use of euphemistic language like "differently abled," microaggressions like "my OCD is kicking in," and presumptions about disabled people's capacities that result in either condescension or lowered expectations. Participants highlighted the range of accessibility issues that exist throughout university operations by citing anything from the absence of Braille printers to rigid work rules. This basis enabled one to link individual actions to more general concepts of equity and inclusion, so helping to explain why technical accessibility training matters beyond simple compliance.
Figure 2: A look back at GAAD celebrations at ODU Libraries: From 2021 to 2024
Technical instruction and practical learning
With Dr. Cook-Snell guiding participants through key steps including auto-tagging documents, adding alternative text to images, ensuring proper reading order, and making interactive forms navigable by assistive technologies, the technical part of the workshop concentrated on practical skills using Adobe Acrobat Pro creating accessible PDFs. Emphasizing Web Content Accessibility Guidelines (WCAG), the training focused on referencing ODU's official IT policy mandating compliance with Section 508 of the Rehabilitation Act. Although hand editing is usually required for best results, participants discovered that the auto-tag feature in Adobe Acrobat provides a great basis for accessibility. Important ideas, including contrast ratios, descriptive link text for screen readers, and the distinctions between decorative and functional images that call for alternative text descriptions, were discussed in the session. Dr. Cook-Snell explained the need of appropriate document structure for screen reader navigation, showed participants how to negotiate the reading order panel, and displayed the accessibility checker feature. Participants asked intelligent questions about managing workflow when documents need frequent revisions, juggling accessibility with security concerns for sensitive documents, and selecting suitable screen readers for testing throughout the technical instruction. Several participants said they had fresh respect for accessibility tools they had not known existed; one attendee said, "I didn't know this tool existed. I am thus actually quite eager to play about with it a little more.” Another participant verified that the second time around the process became "slightly easier," so motivating ongoing skill development. The conversation exposed the difficulty of implementing accessibility policies as well as the sincere dedication of ODU community members—even in face of technological constraints—to create inclusive digital spaces.
Figure 3: Image shows a hybrid session of the event in progress. In the top-left panel, a live video feed captures the in-person attendees at Perry Library Room 1306. The top-right panel features Kristin M. Osborne, joining virtually from ODU Global. The bottom panel shows Emily S. Harmon, also participating remotely.
Community Input and Next Projects
Extensive comments gathered at the workshop will guide the next EWDA projects. Participants suggested several valuable improvements, including providing step-by-step checklists for reference during hands-on activities, sharing materials through multiple channels (Google Drive, Zoom chat) for better accessibility, implementing a "flipped" approach where participants attempt tasks independently before group problem-solving, offering progressive learning opportunities through multi-session series, and establishing regular "office hours" for ongoing accessibility support. One participant's recommendation for a seminar series, "I think this would be a great seminar and not just stopping here, but offering it in several stages... Like today was intro, then perhaps we do another one in a month with an emphasis on a different component". The event effectively exposed many attendees to EWDA's mission and ongoing projects, including developing mentoring programs, building communication channels via newsletters and social media, and forming advocacy committees to compile community comments on accessibility improvements. Encouragement of attendees to join EWDA's expanding membership—which welcomes allies dedicated to accessibility advocacy as well as workers with disabilities— to show their dedication to inclusive participation from the beginning, the company also declared an active logo design contest, inviting community members to provide graphic representations of their mission.
Looking Ahead: Institutional Change and Continuous Impact
Beyond the immediate attendees, the success of the workshop attracted interest from Dr. Cook-Snell, who mentioned Provost Payne's expressed desire in bringing comparable programming to the university level, and from Dean Dice of the College of Education, who underlined the importance of "actionable items" that can significantly challenge university community barriers. This awareness reflects the larger momentum around accessibility that defined GAAD 2025 globally, as organizations all around concentrated on "Committing to Change" using pragmatic, hands-on methods to turn awareness into actual accessibility improvements. The popularity of "Accessible By Design" shows that effective, meaningful accessibility training calls for both consciousness-raising about disability inclusion and technical skill-building about accessibility. The workshop laid a basis for ongoing institutional change rather than one-time awareness by combining useful tools with more general conversations of ableism and institutional barriers. While the passion and careful participation shown by participants suggest continuous interest in developing accessibility competencies, Dr. Cook-Snell promised to create more thorough written guides based on participant feedback and to set regular office hours for ongoing accessibility support. Notwithstanding technical difficulties, the hybrid format effectively modeled inclusive programming by allowing both in-person and remote participants to interact with the material, so offering a template for the next EWDA projects. Accessibility is everyone's responsibility, as GAAD 2025 reminds us globally; ODU's workshop gave community members the tools and inspiration to make accessibility a top concern in their daily work, so transcending compliance towards real inclusion.
I'd like to acknowledge Dr. Michael Nelson for his indispensable support in reviewing my blog. His proficiency and insights significantly enhanced its quality.
I discussed LLMs' hallucinations and demonstrated their inability to correctly cite Quranic verses using Google Gemini as an example in part 1 of this blog post. Google Gemini's answers to different prompts included incorrect Quranic citations and phrases that do not exist in the Quran attributed to specific verses in the Quran. I also explained the importance of correctly citing and presenting Quranic verses in Arabic. Here, in part 2, I present a comparison between Google Gemini and Open AI's ChatGPT. Using the same prompts, ChatGPT-4o hallucinations produced similar results to that of Google Gemini. Again, misinformation remains one of the biggest challenges that compromises LLMs' credibility quoting verses from the Quran in Arabic. Experts in Classical Arabic and those who memorize the Quran word for word can identify errors in ChatGPT's output, however, less educated people will have difficulty distinguishing between correct and incorrect answers from ChatGPT. Some Arabic speakers have examined ChatGPT's answers and found them to have significant errors when referencing the Quran.
Improvements in ChatGPT over the last two years
The paper I reviewed in part 1 of this post tested ChatGPT-3.5 in 2023 using a sample of prompts regarding the Quran's views on misinformation. The authors found the output to have significant and consistent errors. They regenerated queries to the question “What does the Quran have to say about misinformation?”. They also sampled responses from ChatGPT with the additional prompt “please cite verses in Arabic”. The errors in the output ranged from producing correctly quoted and cited, yet irrelevant Quranic material to misordering the words of Quranic verses; the errors were not minor. They also found hallucinations in ChatGPT's answers attributing text that doesn't exist in the Quran at all to specific chapters and verses in the Quran. I repeated their experiment on ChatGPT-4o in January 2025 and I was unable to reproduce their output. I did not get incorrect Quranic citations or verses that did not exist in the Quran. I did not get any altered verses from the Quran in any way. Every output was correct, accurate, and authentic.
Correct answers from ChatGPT
However, when I repeated the experiment I did with Google Gemini in part 1 of this post in January of 2025 and asked ChatGPT for additional verses in Arabic, the results were not much better than the ones I got from Google Gemini. ChatGPT provided the wrong reference one time when I asked for additional verses on misinformation. In addition, ChatGPT provided phrases that do not exist in the Quran and attributed them to specific verses in the Quran when I tried different prompts that are not in the paper, but they have the same meaning. Although the errors in ChatGPT's output are not as bad as the ones I found in Google Gemini's, I think the impact is worse because the wrong verses are closer to correct verses in the Quran, and they can definitely be taken as correct verses to the non-expert. The difference was in one letter in one case and one word in another case. The output's syntax was also wrong in the latter.
Wrong chapter and verses' numbers from ChatGPT
Me: Give me additional verses
ChatGPT:
Certainly! The Quran repeatedly emphasizes the dangers of misinformation, falsehoods, and irresponsible speech. Here are additional verses in Arabic that address this issue:
🔹 "And indeed, there is among them a party who alter the Scripture with their tongues so that you may think it is from the Scripture, but it is not from the Scripture. And they say, 'This is from Allah,' but it is not from Allah. And they speak a lie against Allah while they know [it]."
🔹 "Then whoever argues with you about it after knowledge has come to you, say, 'Come, let us call our sons and your sons, our women and your women, ourselves and yourselves, then supplicate earnestly and invoke the curse of Allah upon the liars.'"
8. Do Not Falsify Facts or Distort the Truth
📖 Surah Al-Ma’idah (5:41)
يُحَرِّفُونَ الْكَلِمَ مِنْ بَعْدِ مَوَاضِعِهِ
🔹 "They distort words from their [proper] places..."
🔹 "And when you see them, their forms please you, and if they speak, you listen to their speech. [They are] like pieces of wood propped up – they think that every shout is against them. They are the enemy, so beware of them. May Allah destroy them; how are they deluded?"
🔹 "And on the Day of Resurrection, you will see those who lied against Allah – their faces will be blackened. Is there not in Hell a residence for the arrogant?"
🔹 "O you who have believed, fear Allah and speak words of appropriate justice. He will [then] amend for you your deeds and forgive you your sins. And whoever obeys Allah and His Messenger has certainly attained a great attainment."
Conclusion
The Quran strongly condemns misinformation, distortion, and falsehood. It teaches that:
✅ Truthfulness leads to success
❌ Spreading falsehoods leads to regret and punishment
⚠️ Lies cause harm, injustice, and corruption in society
Would you like a deeper explanation of any verse? 😊
The 9th quoted verse (highlighted in red) is a verse from the Quran, but it is not in Quran 58:14-15. It is in Quran 63:4. The two verses in Quran 58:14-15 are:
Have you noted those who befriended people with whom GOD is angry? They neither belong with you, nor with them. They deliberately swear lies! (14) GOD has prepared for them a severe retribution. Miserable indeed is what they used to do. (15)
ChatGPT correctly cited the Quran 63:4 (highlighted green) in the following answer when I repeated the prompt.
Me: Give me additional verses
ChatGPT:
Certainly! The Quran contains many verses warning against misinformation, lying, and spreading falsehoods. Here are additional verses in Arabic, along with their meanings:
🔹 "So who is more unjust than one who lies about Allah and denies the truth when it has come to him? Is there not in Hell a residence for the disbelievers?"
🔹 "So He penalized them with hypocrisy in their hearts until the day they will meet Him – because they failed Allah in what they promised Him and because they used to lie."
🔹 "And We have certainly tested those before them, and Allah will surely make evident those who are truthful, and He will surely make evident the liars."
🔹 "And those who harm believing men and believing women for [something] other than what they have earned have certainly borne upon themselves a slander and manifest sin."
🔹 "And when you see them, their forms please you, and if they speak, you listen to their speech. [They are] like pieces of wood propped up – they think that every shout is against them. They are the enemy, so beware of them. May Allah destroy them; how are they deluded?"
🔹 "Unquestionably, for Allah is the pure religion. And those who take protectors besides Him [say], 'We only worship them that they may bring us nearer to Allah in position.' Indeed, Allah will judge between them concerning that over which they differ. Indeed, Allah does not guide one who is a liar and disbeliever."
🔹 "You only worship, besides Allah, idols, and you invent falsehood. Indeed, those you worship besides Allah do not possess [for] you [the ability to provide] sustenance. So seek sustenance from Allah and worship Him and be grateful to Him. To Him you will be returned."
🔹 "And on the Day of Resurrection, you will see those who lied about Allah with their faces blackened. Is there not in Hell a residence for the arrogant?"
🔹 "And among them are unlettered ones who do not know the Scripture except [indulgement in] wishful thinking, but they are only assuming. So woe to those who write the 'scripture' with their own hands, then say, 'This is from Allah,' in order to exchange it for a small price. Woe to them for what their hands have written, and woe to them for what they earn."
14. Falsehood Leads to Corruption
📖 Surah Al-Ma’idah (5:41)
يَسْمَعُونَ لِلْكَذِبِ أَكَّالُونَ لِلسُّحْتِ
🔹 "They listen to falsehood and consume forbidden gain..."
🔹 "And do not take your oaths as a means of deception among yourselves, lest a foot slip after it was firmly planted, and you would taste evil for what you diverted from the way of Allah, and you would have a great punishment."
🔹 "O children of Adam, let not Satan tempt you as he removed your parents from Paradise, stripping them of their clothing to show them their private parts. Indeed, he sees you, he and his tribe, from where you do not see them. Indeed, We have made the devils allies to those who do not believe."
🔹 "Say, 'Shall We inform you of the greatest losers in respect to [their] deeds? Those whose effort is lost in worldly life, while they think that they are doing well in work.'"
🔹 "When the hypocrites come to you, [O Muhammad], they say, 'We testify that you are the Messenger of Allah.' And Allah knows that you are His Messenger, and Allah testifies that the hypocrites are liars."
19. Those Who Lie About Allah Will Face Severe Punishment
🔹 "And Allah establishes the truth by His words, even if the criminals dislike it."
Conclusion
The Quran strongly warns against falsehood, deception, and lying. It teaches that:
✅ Truth will always triumph
❌ Falsehood leads to disgrace and punishment
⚠️ Lying is a characteristic of the corrupt and hypocrites
Would you like more explanations or interpretations? 😊
ChatGPT attributed the phrase يَسْمَعُونَ لِلْكَذِبِ أَكَّالُونَ لِلسُّحْتِ to Quran 5:41 in item number 14 in the answer. While this is an incorrect citation and the syntax of the phrase is also incorrect, Quran 5:42 has a very similar phrase سَمَّاعُونَ لِلْكَذِبِ أَكَّالُونَ لِلسُّحْتِ
The phrase in ChatGPT's output translates to: They are listening to lies, devourers of what's forbidden (bribery).
The phrase from Quran 5:42 translates to: Listeners to lies, devourers of what's forbidden (bribery).
I was able to catch this error quickly because I have read the entire Quran multiple times and have seen and heard the correct verse so many times. I absolutely remember it. For someone who haven't seen it or unaware of the wrong syntax, they will not be able to identify this error.
The second error in ChatGPT's output is even worse because the difference is only in one letter. I was only able to identify this error because I checked each and every verse in the output of this entire experiment with an authentic copy of the Quran (word for word). ChatGPT attributed the phrase مَنۢ أَظْلَمُ مِمَّنِ ٱفْتَرَىٰ عَلَى ٱللَّهِ كَذِبًا to Quran 18:15 in item number 19 in the answer. While this is an incorrect citation, the syntax of the phrase is not necessarily incorrect. The only difference between this phrase and a phrase in Quran 18:15 is a deletion of one letter (ف) from the first word in the phrase. The deletion does not change the meaning or make it wrong syntactically since the output is lacking the context (the previous phrase in the same verse). To someone who doesn't memorize this verse word for word, this error cannot be identified.
Quran 18:15 has the phrase فَمَنْ أَظْلَمُ مِمَّنِ افْتَرَىٰ عَلَى اللَّهِ كَذِبًا
The translation of both phrases (the correct one and the wrong one) is:
Who is more evil than the one who fabricates lies and attributes them to GOD?
In January 2025, I was unable to reproduce the errors that Ali-Reza Bhojani and Marcus Schwarting found in 2023 in ChatGPT's output. The output of ChatGPT was consistently correct to the prompts mentioned in the paper. I tried to archive the ChatGPT's answers to the prompts I issued. Although SPN said that a snapshot was captured, when trying to retrieve the archived copy, the page said that the Wayback Machine has not archived that URL.
The Internet Archive was unable to archive chat with ChatGPT
It is possible to archive the entire chat(s) with ChatGPT if the user created a public link (shareable) for the chat and submitted it to archive.is
Creating a public link to chat with ChatGPT
The created/updated link from ChatGPT to be shared and archived
Note that this method of archiving the chat with ChatGPT does not work with the Internet Archive. It looks like the page has been saved using SPN, but the page does not replay.
ChatGPT cannot provide accurate citations from the Quran in Arabic
From this experiment, I found that ChatGPT "improvement" is similar to that of Google Gemini (from part 1 of this post). They both did not produce errors for the same prompts issued in the paper in 2023. The results were all correct citations with no errors, however, the answers had wrong citations to correct verses in the Quran for different prompts that have the same meaning. ChatGPT, as well as Google Gemini, provided phrases that do not exist in the Quran (mixtures of words that exist in the Quran and elsewhere) and attributed them to the Quran. Some of these phrases included syntax errors and altered verses attributing them to the Quran which is problematic for Muslims who believe that the Quran is free from errors and modifications.
After two years and going from ChatGPT-3.5 to ChatGPT-4o, the errors and hallucinations remain present when using slightly different prompts. Some researchers argue that LLMs' errors and hallucinations not only will remain present in all LLMs, but they will increase as more and more LLMs' generated content make it to the training datasets (content on the internet), and result in a total collapse of the model.
Conclusions
LLMs have taken the world by surprise in the last few years with the introduction of chatbots like OpenAI’s ChatGPT. LLMs have been misused in the past and they will continue to be misused by some users. Misinformation is one of the toughest problems with LLMs. In this post, we demonstrated that ChatGPT's hallucinations continue to prevent it from being able to provide correct Quranic citations. Unfortunaqtely, Wrong ChatGPT's answers to questions about the Quran are presented in a Quranic-like format which makes users believe them to be correct references to the Quran. ChatGPT also mixes correct and incorrect Quranic citations making it harder for non-experts to separate right from wrong answers. The mixture of incorrect and correct Quran citations is not accepted by Muslims who believe the Quran to be free from errors and should never be modified. Some researchers argue that misinformation cannot be eliminated from LLMs because training datasets will continue to have both misinformation and disinformation.
By the time I finished trying to reproduce the results in the paper I reviewed in Part 1 and Part 2 of this blog post, DeepSeek released its first free chatbot app DeepSeek-V3 on January 20th 2025. I could not fight the urge to see how it compares to Open AI's ChatGPT and Google Gemini. The purpose of this experiment is to provide a disproof by counter example, that, contrary to popular belief, LLMs are not capable of producing error-free answers to questions. I am using prompts to find Arabic verses in the Quran on misinformation.
I repeated the same experiment I did with Google Gemini and ChatGPT-4o in January 2025; the results were not better. In addition to being slower, I kept getting the annoying message "The server is busy message. Please try again later." which I didn't try to find a solution for because the service got restored when I waited and tried again later. For prompts tested in the paper, DeepSeek's answers to the first prompt (What does the Quran have to say about misinformation?) were consistent and correct. No incorrect or made-up verses attributed to the Quran. Similarly, no errors in the answers when I asked this question to "What does the Quran have to say about misinformation? please cite verses in Arabic" to see how DeepSeek performs citing Quranic verses in Arabic. DeepSeek correctly cited Quran 2:42, 49:6, 24:15-16, 17:36, 50:18, 25:72, and 49:12 two times in a row. However, when I asked for additional verses, one of DeepSeek's presented phrases was correct, but it attributed the phrase to a different verse in a different chapter in the Quran.
Me: Give me additional verses
DeepSeek: Okay, the user has already asked about what the Quran says regarding misinformation and received several detailed responses with cited verses. Now they're asking for additional verses. I need to make sure I don't repeat the ones already mentioned. Let me recall the previous answers and check which verses were covered.
In the last interaction, I listed seven key verses in Arabic with translations. So the user now wants more verses beyond those. Let me think of other relevant Quranic verses that address truthfulness, lying, false testimony, or spreading false information.
Surah Al-Isra (17:35) comes to mind about fulfilling measures and testifying with justice. Then Surah Al-Ma'idah (5:8) talks about standing for justice even against oneself. Surah Al-Mu'minun (23:3) mentions avoiding vain talk. Surah Al-Hajj (22:30) advises avoiding false speech. Surah Al-Baqarah (2:283) discusses trust and testimony. Surah Al-Nahl (16:105) specifies that liars disbelieve in Allah's signs. Surah Al-Mutaffifin (83:1-3) condemns fraud. Surah Al-An'am (6:144) warns against speaking without knowledge. Surah Al-Nisa (4:112) talks about bearing sin for false accusations.
I should present these new verses in Arabic with transliteration and translation, ensuring they haven't been mentioned before. Also, the user might be looking for a comprehensive list for study or reference, so context and lessons are important. Need to organize them clearly, maybe with headings for each verse. Let me verify the references to avoid errors. Once checked, structure the response with each verse, its Arabic text, transliteration, translation, context, and a key lesson. Conclude by summarizing the Quran's stance on truth and integrity. Make sure the formatting is consistent with previous answers for clarity.
Certainly! Here are additional Quranic verses in Arabic that emphasize truthfulness, condemn falsehood, and guide ethical communication, along with translations and contexts:
Translation: "O believers! Stand firm for Allah as witnesses for justice, and do not let hatred of a people lead you to injustice. Be just—that is closer to righteousness."
Context: Commands justice in speech and testimony, even toward enemies.
________________________________________
3. Avoiding Vain Speech
Quran 23:3
Arabic:
وَالَّذِينَ هُمْ عَنِ اللَّغْوِ مُعْرِضُونَ
Transliteration: Wa alladhīna hum ʿani al-laghwi muʿriḍūn.
Translation: "And those who turn away from ill speech."
Context: Praises those who reject gossip, slander, and meaningless talk.
________________________________________
4. Prohibition of False Speech
Quran 22:30
Arabic:
وَاجْتَنِبُوا قَوْلَ الزُّورِ
Transliteration: Wa ijtānibū qawla al-zūr.
Translation: "And shun false speech."
Context: Part of a broader command to avoid all forms of sin, including lies.
Transliteration: Wa man yaksib khaṭī’atan aw ithman thumma yarmi bihi barī’an faqadi iḥtamala buhtānan wa ithman mubīnā.
Translation: "Whoever commits a sin or error and then blames it on an innocent person has borne a grave slander and a manifest sin."
Context: Reiterates the gravity of false accusations.
________________________________________
Key Lessons
•Integrity in Speech: The Quran repeatedly ties truthfulness to faith (e.g., 16:105).
•Social Justice: Lies harm individuals and communities (2:283, 83:1–3).
•Divine Accountability: Every word and intention is recorded (50:18).
•Rejecting Harm: Silence in the face of falsehood is complicity (24:15–16).
These verses collectively establish a robust ethical framework for combating misinformation, urging believers to prioritize truth, fairness, and responsibility in all communication.
And of the camels two (male and female), and of oxen two (male and female). Say: "Has He forbidden the two males or the two females or (the young) which the wombs of the two females enclose? Or were you present when Allâh ordered you such a thing? Then who does more wrong than one who invents a lie against Allâh, to lead mankind astray without knowledge. Certainly Allâh guides not the people who are Zâlimûn (polytheists and wrong-doers)."
It is interesting that item number nine in the answer, right below number eight, is the same verse but correctly referenced this time.
Wrong chapter and verse number from DeepSeek
I asked DeepSeek for additional verses, and this time, DeepSeek started to hallucinate. The answer included a phrase that does not exist in the Quran at all, but DeepSeek attributed the phrase to a specific verse in the Quran.
Me: Give me additional verses
Thought for 37 seconds
DeepSeek: Okay, the user has asked for additional Quranic verses related to misinformation again. Let me see. They previously requested verses in Arabic with translations, and I provided several. Now they want more.
First, I need to recall which verses I've already listed. The previous ones included 2:42, 49:6, 24:15-16, 17:36, 50:18, 25:72, 49:12, and then in the last response, I added 17:35, 5:8, 23:3, 22:30, 2:283, 16:105, 83:1-3, 6:144, 4:112. So I need to find more verses that haven't been mentioned yet but still address truthfulness, falsehood, gossip, or accountability in speech.
Let me check other relevant verses. Surah Al-Ma'idah 5:2 comes to mind about cooperation in righteousness. Also, Surah Al-Isra 17:34 about fulfilling promises. Surah Al-Hujurat 49:11 prohibits insulting others. Surah Al-Mutaffifin 83:29-36 talks about the consequences for those who mock believers. Surah Al-Baqarah 2:188 warns against deceit in property. Surah Al-Ahzab 33:70-71 encourages truthful speech. Surah Al-Mumtahanah 60:12 on not hiding testimony. Surah Al-Nahl 16:116 against lying about what's permissible. And Surah Al-Tawbah 9:119 urges being with the truthful.
I need to present these in the same format as before: Arabic, transliteration, translation, and context. Make sure the translations are accurate and the contexts clearly relate to misinformation or ethical communication. Also, check if any of these were already covered. For example, 2:283 was mentioned before, so I should avoid repetition. Wait, 2:188 is about property, which is a form of deceit, so it's relevant. Similarly, Surah Al-Tawbah 9:119 is about being with the truthful, which supports truthfulness in general.
Ensure that each verse adds value to the topic. For instance, Surah Al-Ma'idah 5:2 encourages cooperation in good deeds and avoiding sin, which ties into promoting truth and avoiding falsehood. Surah Al-Isra 17:34 about fulfilling promises relates to honesty. Surah Al-Hujurat 49:11 is about not insulting, which is a form of harmful speech.
Double-check the translations for accuracy. Maybe use Sahih International or another reputable translation. Also, verify the Arabic script to ensure it's correct. Organize them in a logical order, perhaps by theme. Start with cooperation in righteousness, then fulfilling promises, avoiding insults, mocking others, deceit in transactions, truthful speech, hiding testimony, lying about halal/haram, and the call to be with the truthful.
Finally, summarize the key lessons from these additional verses to reinforce the Quran's stance on truthfulness and against misinformation. Make sure the response is clear and helpful, providing the user with meaningful content that expands on the previous answers without redundancy.
Certainly! Here are additional Quranic verses in Arabic that emphasize truthfulness, condemn deception, and guide ethical communication, along with translations and contexts:
Transliteration: Yā ayyuhalladhīna āmanū ittaqū Allāha wa kūnū maʿa al-ṣādiqīn.
Translation: "O believers! Fear Allah and be with those who are true."
Context: Urges alignment with truthful people, rejecting circles of falsehood.
________________________________________
Key Lessons from These Verses
1.Collective Responsibility: Uphold truth collectively (5:2) and avoid complicity in lies.
2.Integrity in Transactions: Deceit for gain is forbidden (2:188).
3.Dignity in Speech: Mockery, insults, and belittling others are condemned (49:11, 83:29–36).
4.Transparency: Concealing testimony or distorting facts violates trust (60:12, 16:116).
5.Divine Alignment: Truthfulness aligns believers with God’s guidance (33:70–71).
These verses reinforce the Quran’s comprehensive framework for combating misinformation, emphasizing that truth is a divine mandate and lies are a moral and spiritual corruption. In an age of misinformation, these teachings call for vigilance, integrity, and collective accountability.
Item number four in the answer is a reference to two correct verses from Quran 83:29–30, but DeepSeek attributed them to Quran 83:29–36.
Item number seven in the answer attributed the phrase:
The first sentence exists in Quran 60:12 but the second sentence, after the three dots, does not exist in the Quran at all. It translates to "And them (believing women) will not conceal a testimony".
O Prophet! When believing women come to you to give you the Bai'âh (pledge), that they will not associate anything in worship with Allah, that they will not steal, that they will not commit illegal sexual intercourse, that they will not kill their children, that they will not utter slander, intentionally forging falsehood (i.e. by making illegal children belonging to their husbands), and that they will not disobey you in Ma'rûf (Islâmic Monotheism and all that which Islâm ordains) then accept their Bai'âh (pledge), and ask Allâh to forgive them, Verily, Allâh is Oft-Forgiving, Most Merciful.
Wrong answer from DeepSeek
I stopped asking DeepSeek at this point because after performing this experiment on Google Gemini, ChatGPT, and now DeepSeek and getting the same type of errors and hallucinations, I am convinced that LLMs are not capable of correctly quoting verses from the Quran in Arabic. In addition, archiving my questions and DeepSeek's answers by public web archives is not possible because the chat page is behind a login wall which makes it not archivable.
Conclusions
I initially was looking to study LLMs' improvements over the past two years quoting verses from the Quran. Although testing the same prompts in the paper did not produce any errors, slightly changing the prompts while keeping the same meaning resulted in producing errors and hallucinations in the answers using all three tools (Google Gemini, ChatGPT, and DeepSeek). Some researchers warned that misinformation and disinformation cannot be eliminated from LLMs output. They argue that LLMs' errors will continue to increase and result in a total collapse of the model.
The following table outlines the errors each model produced and the experiment year:
Types of errors produced by Google Gemini, ChatGPT, and DeepSeek
Retrieval-Augmented Generation (RAG) might be a promising technique that can significantly reduce errors and hallucinations in LLMs, especially for tasks that involve citing Quranic verses since the Quran has a fixed structure of 114 chapters (Surahs) and a set number of verses (Ayahs). This textual stability makes it an ideal candidate for RAG. The model doesn't need to "guess" or "infer" the content of a verse; it can retrieve the exact text. Therefore, for citing Quranic verses, it is possible that RAG LLM can significantly enhance the reliability and trustworthiness of AI-generated responses involving Quranic citations.


![The Little Ghost Who Was a Quilt [Gift Edition]](https://pics.cdn.librarything.com//picsizes/16/47/16477966-b-h0-w400-pv25_596735762b77435141514141_v5.jpg)


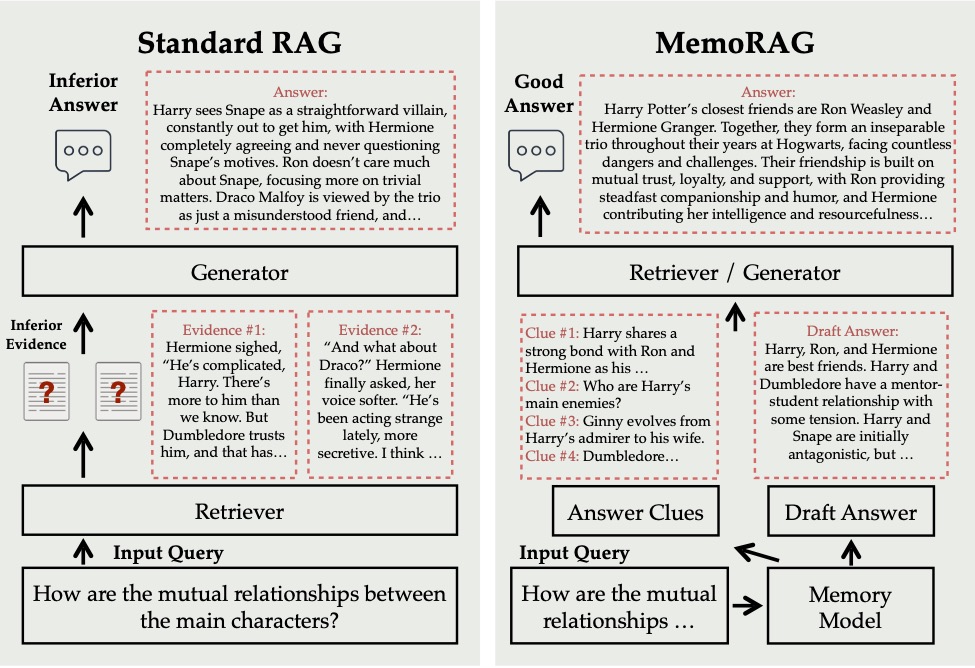
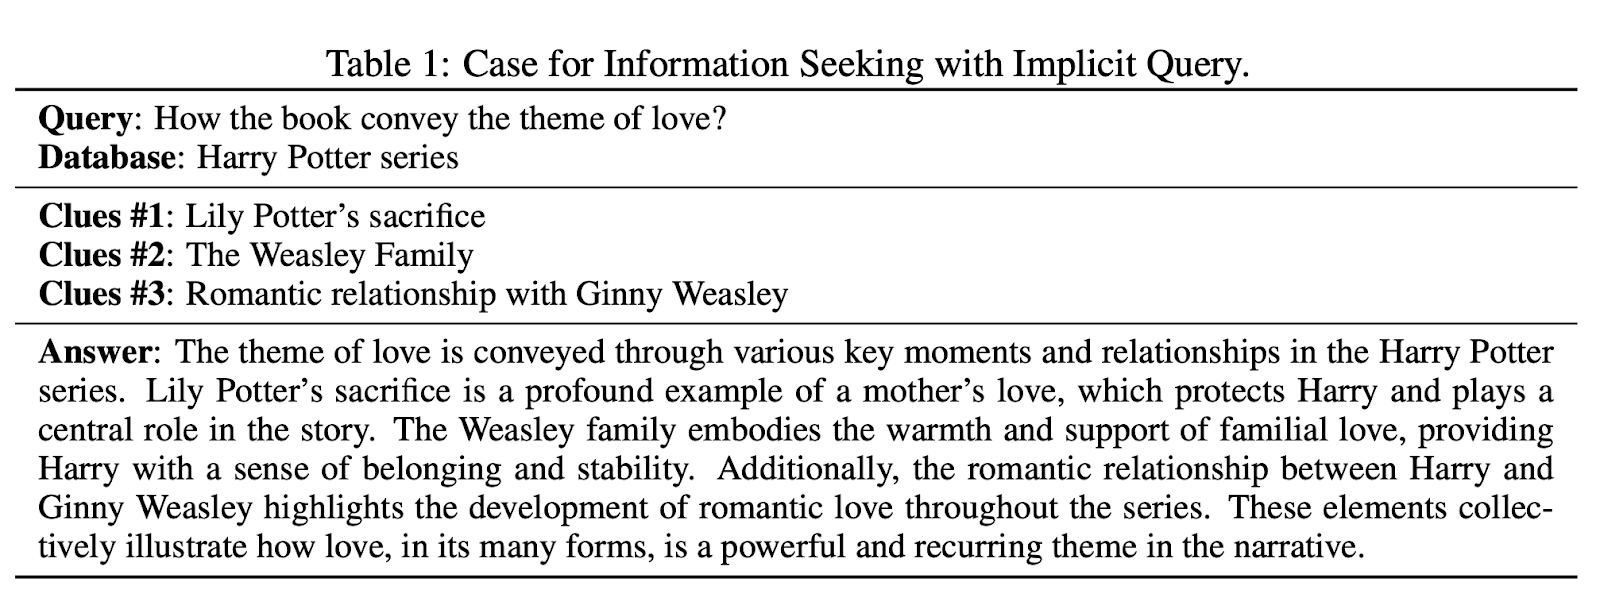


 ︎
︎


.jpg)


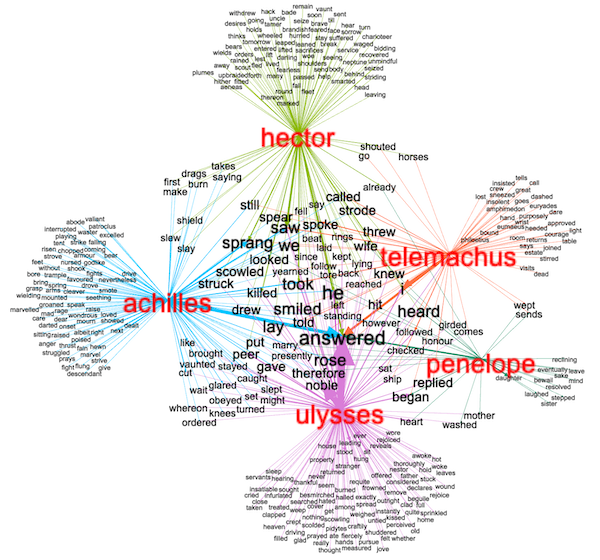


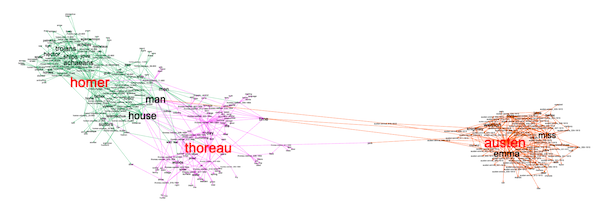


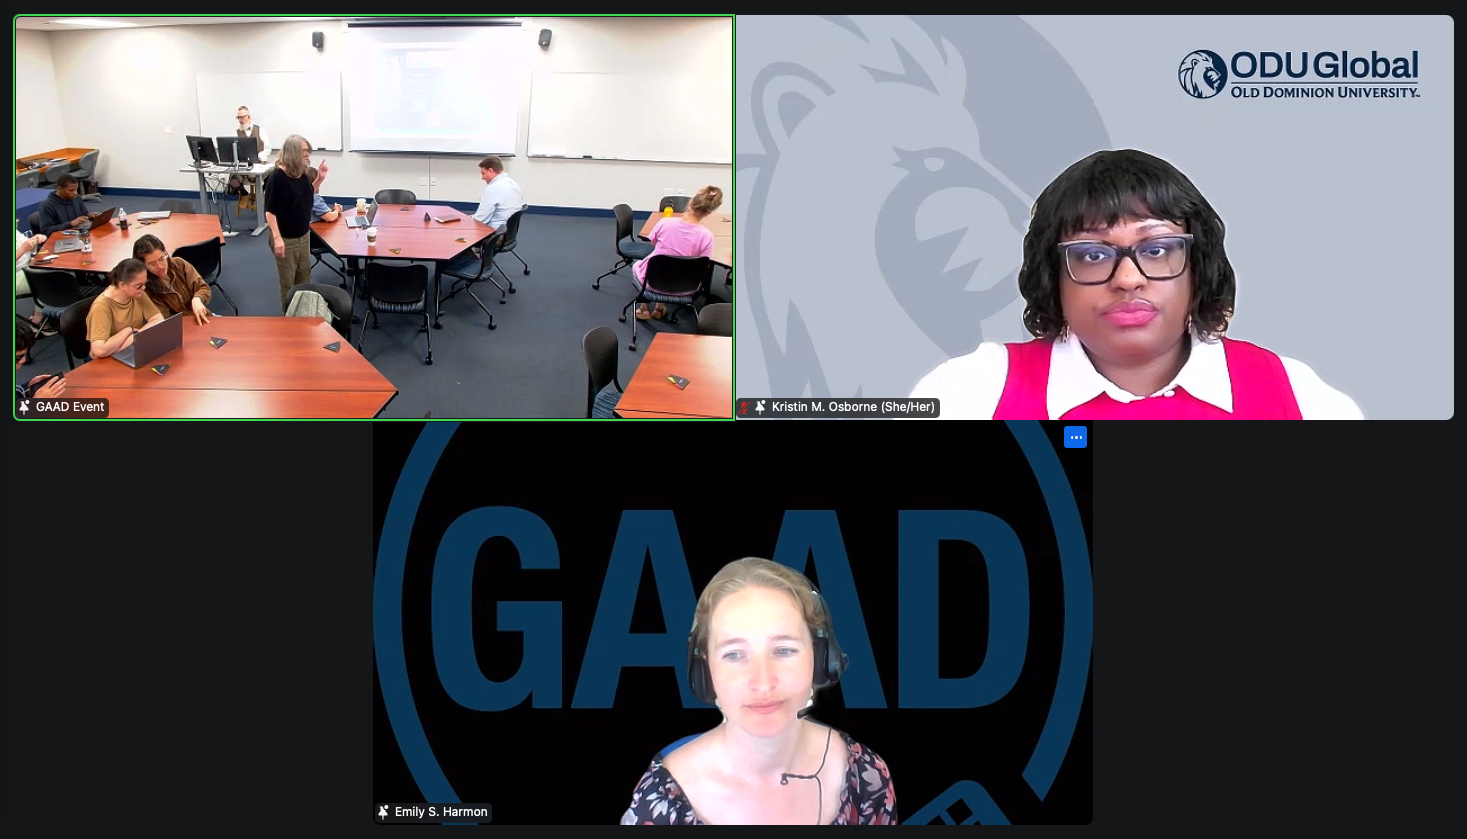


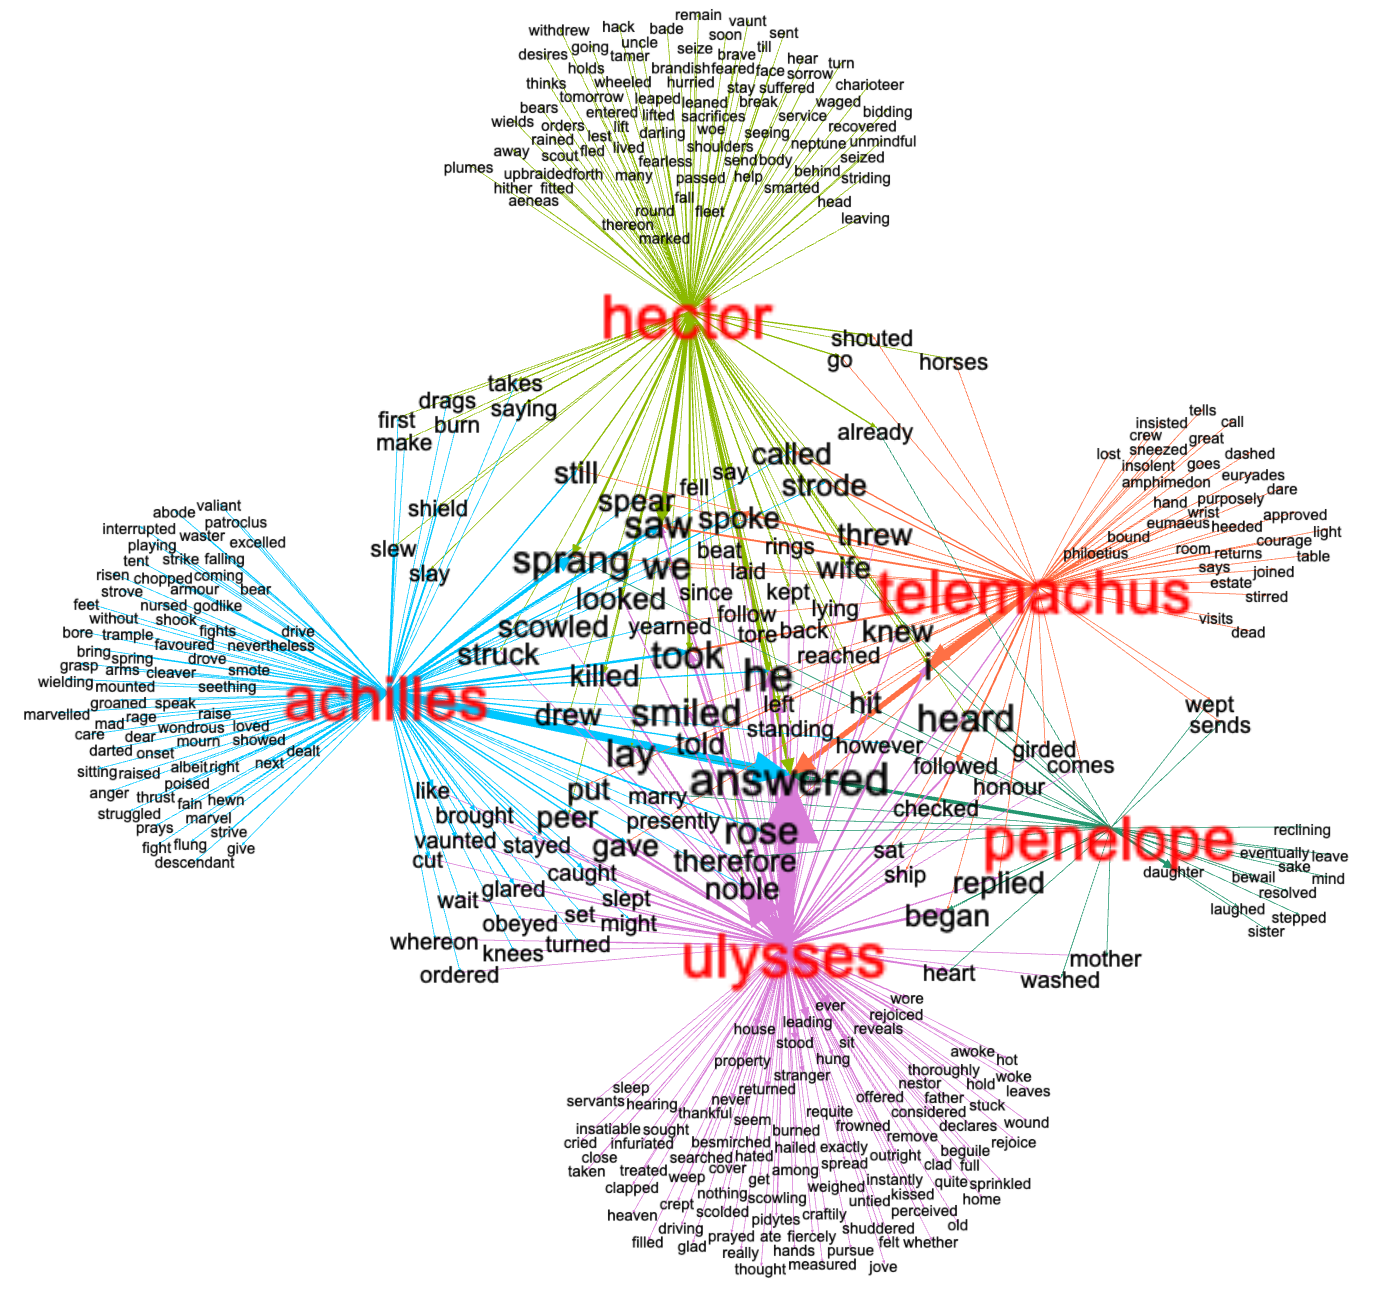
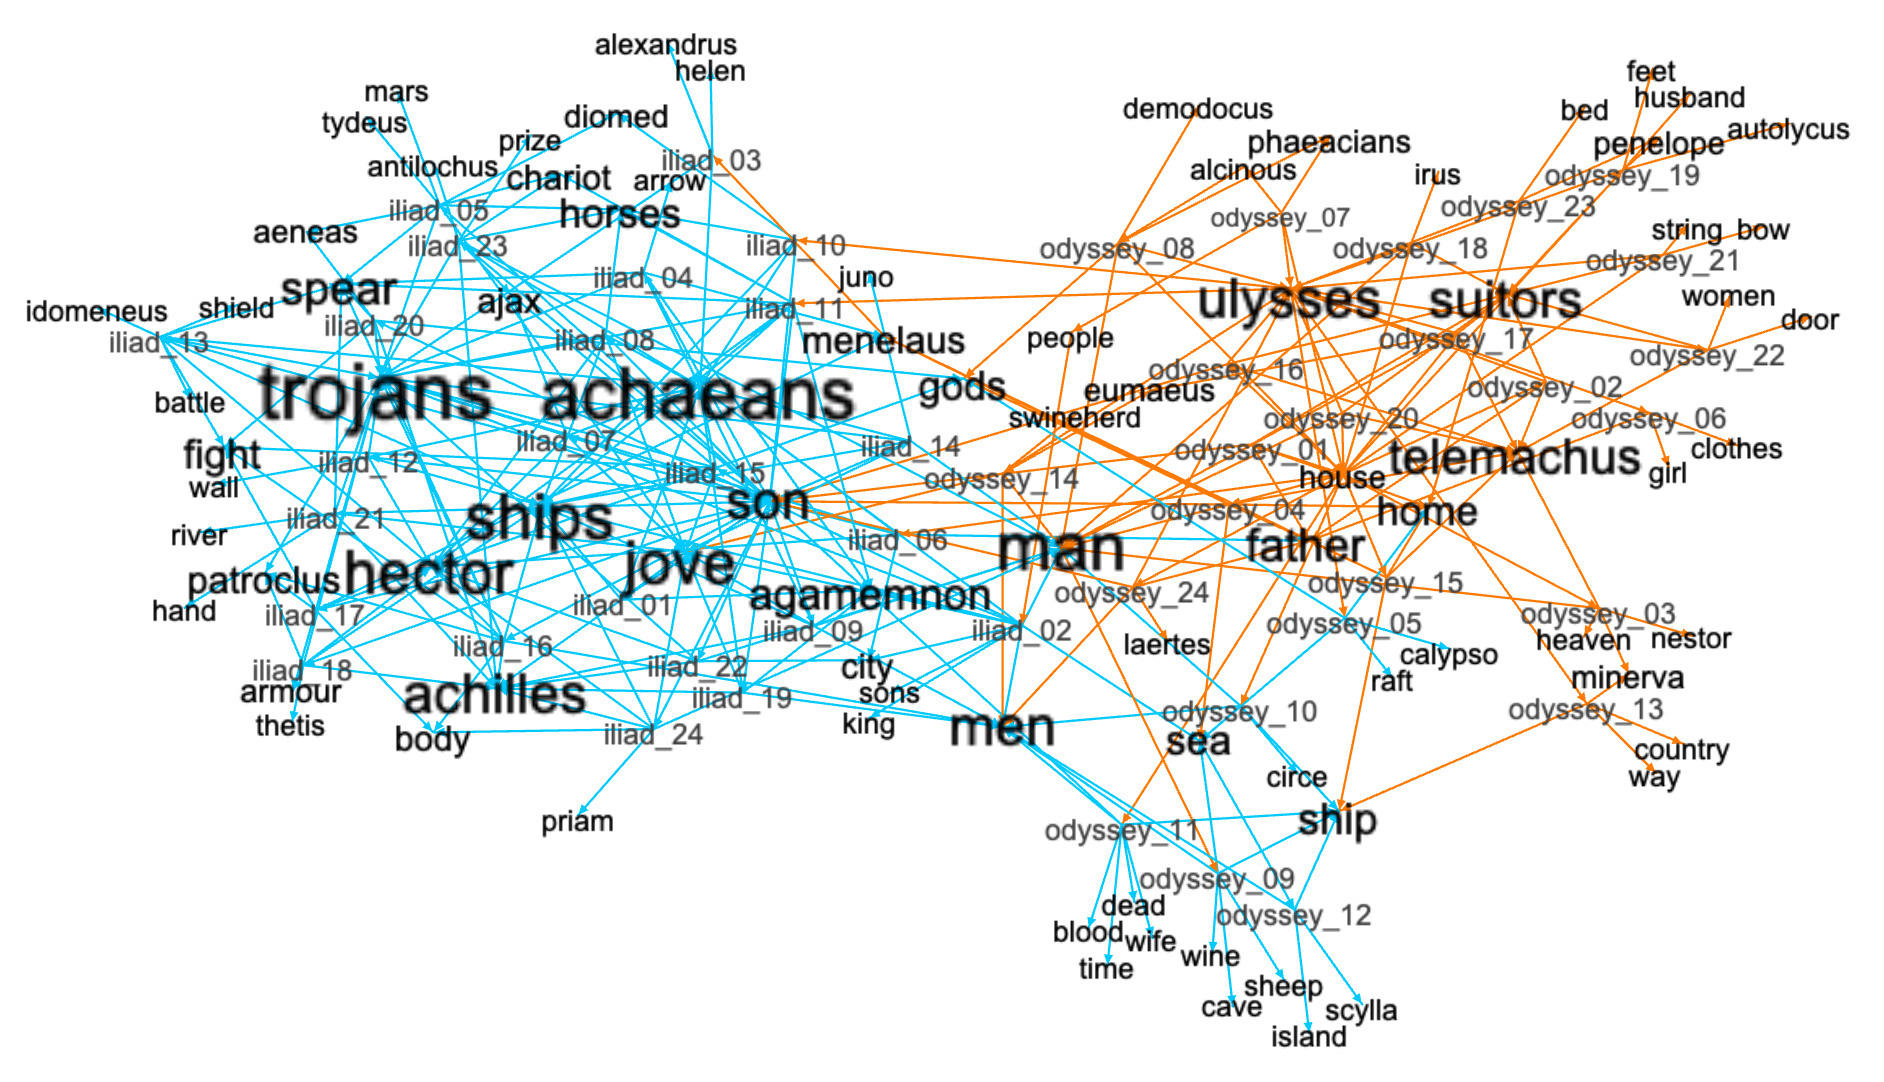
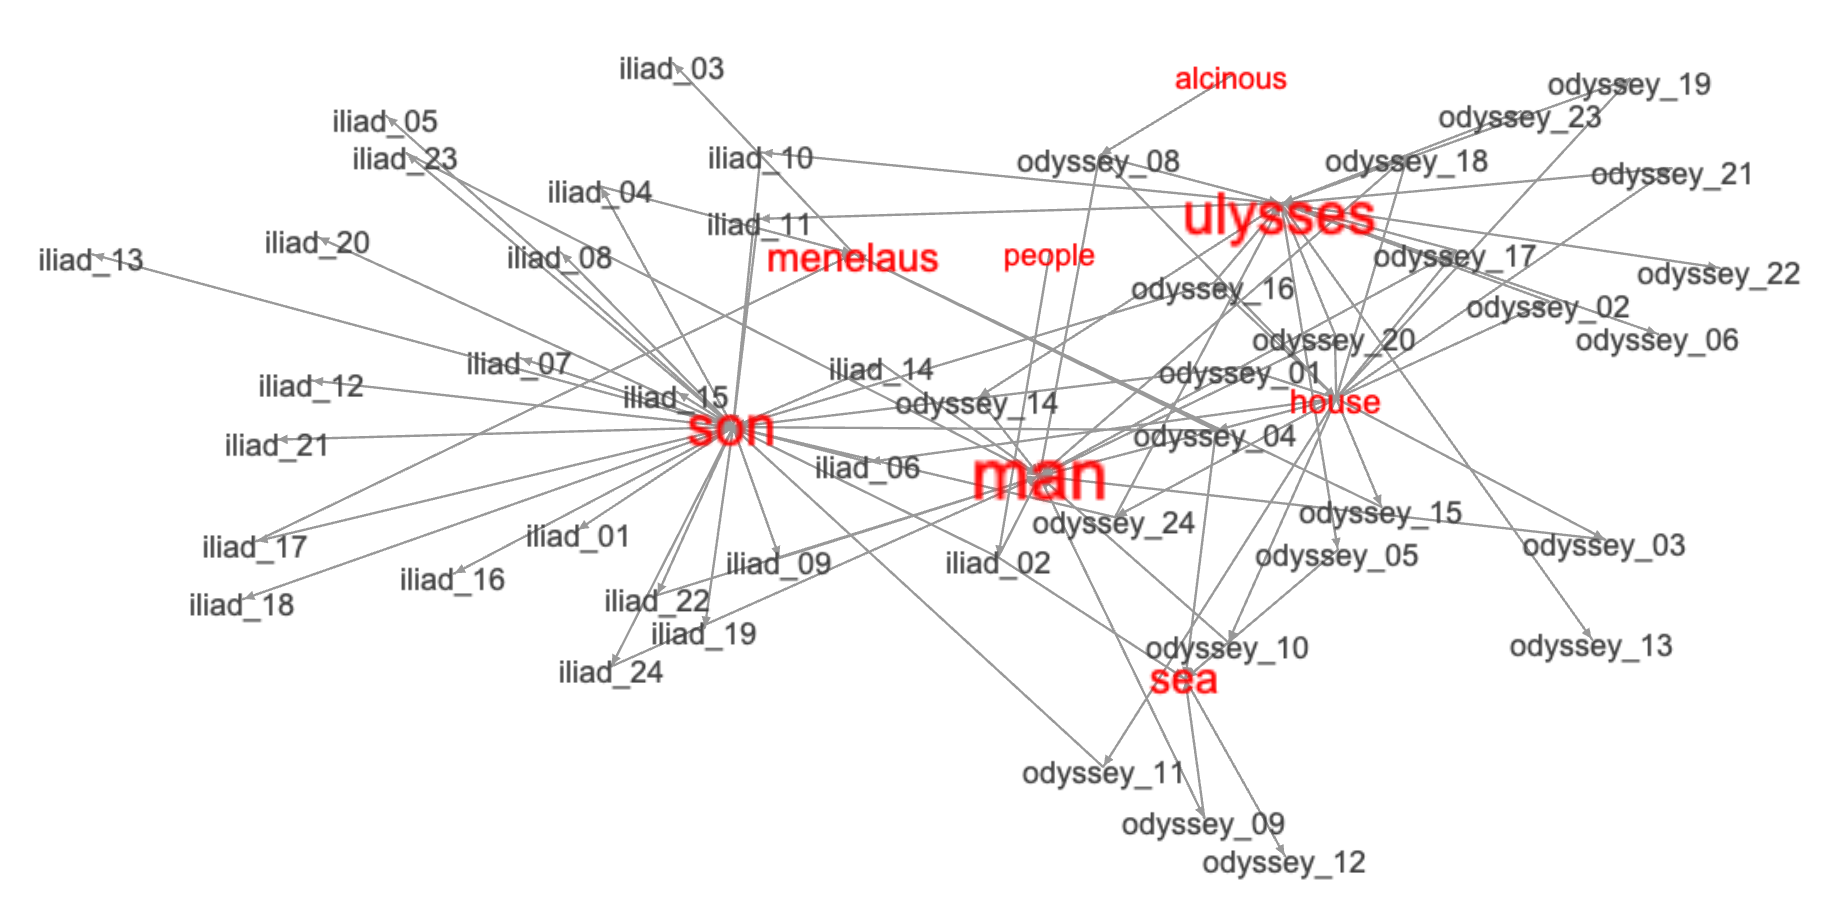